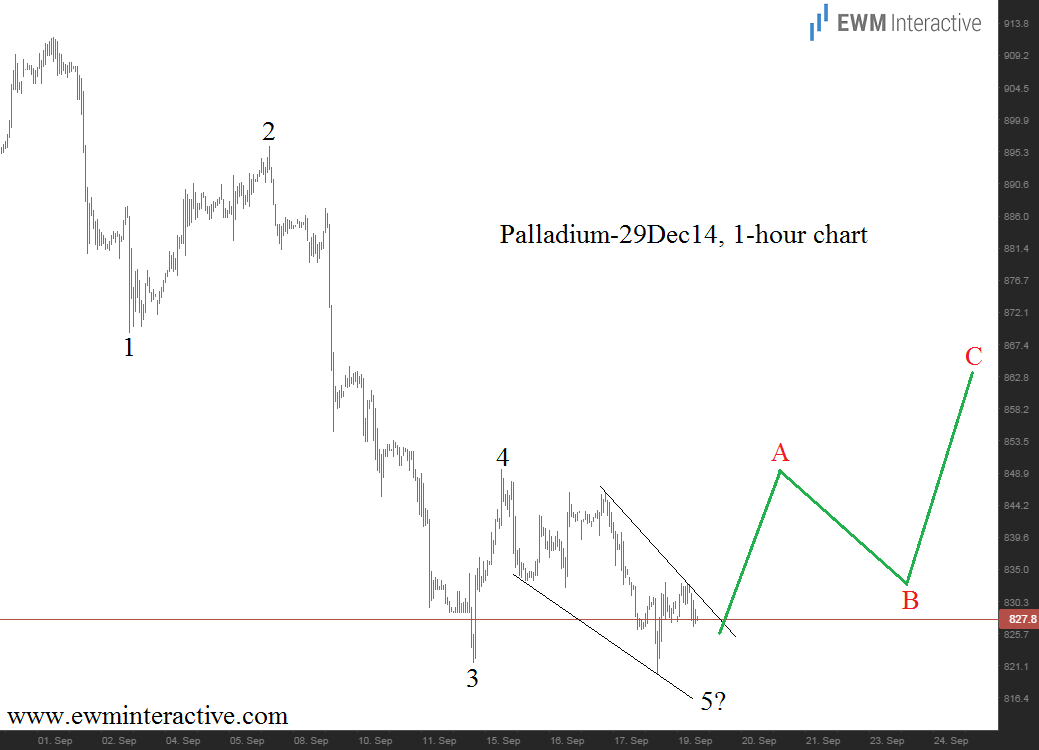
Palladium rose to 912 on September 1, but was unable to keep the bullish momentum and is currently trading close to 830. We are interested not only in the decline itself, but in its wave structure as well, because it can give us a hint of what to expect from now on. The Elliott Wave Principle is the method we use, when analyzing price charts.
According to the Wave Principle, the direction of the trend is demonstrated through five-wave sequences, called impulses. There is one such impulse on the chart of palladium shown above, which means we should accept that the trend is to the downside. However, this does not mean that prices will fall all the time. Usually, trends are interrupted by the so-called corrections. Elliotticians know, that after every five waves, there should be a three-wave correction in the opposite direction. And since palladium has already drawn a five-wave decline, we are preparing for a temporary recovery.
Which stock should you buy in your very next trade?
With valuations skyrocketing in 2024, many investors are uneasy putting more money into stocks. Unsure where to invest next? Get access to our proven portfolios and discover high-potential opportunities.
In 2024 alone, ProPicks AI identified 2 stocks that surged over 150%, 4 additional stocks that leaped over 30%, and 3 more that climbed over 25%. That's an impressive track record.
With portfolios tailored for Dow stocks, S&P stocks, Tech stocks, and Mid Cap stocks, you can explore various wealth-building strategies.
