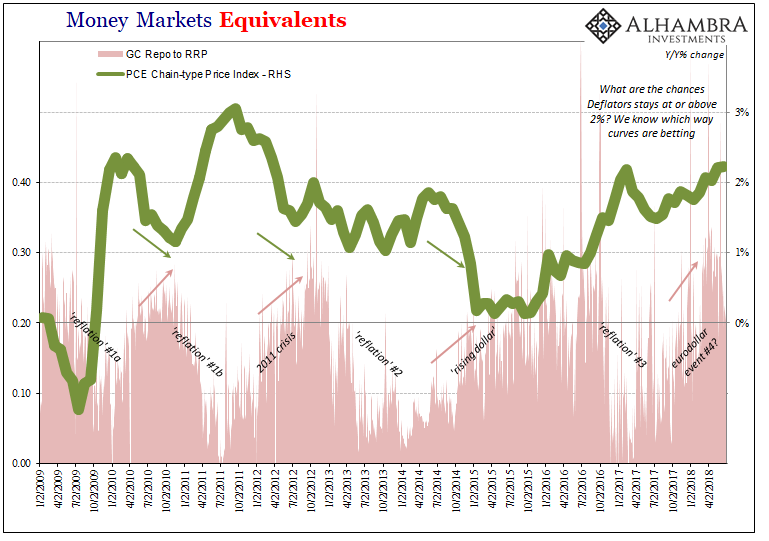
Overshadowed by the “dollar” last week was the Bureau of Labor Statistics. The BLS reported the US CPI had increased in July 2018 by the highest rate since December 2011. Running at 2.95% year-over-year, consumer prices accelerated a little from June’s pace.
Not only that, the CPI’s core rate of inflation sped up to 2.35%. That was the highest since 2008! Because of these lengthy comparisons, the dichotomy between media commentary and actual market reaction was quite remarkable. In the former, there is no stopping this accelerating boom while in the latter there is only a sense of growing concern.
This, obviously, is a huge difference from late last year and the beginning of this year. Inflation hysteria was hysterical only by a matter of degree. The mainstream rhetoric was at least in the same direction as market trading, the difference being only one of enthusiasm (much less in the markets).
Now, the bond market, which has shrugged off the past few months of the CPI (and PCE Deflator), doesn’t even pay attention to the number at all. There are, apparently, much bigger things afoot.
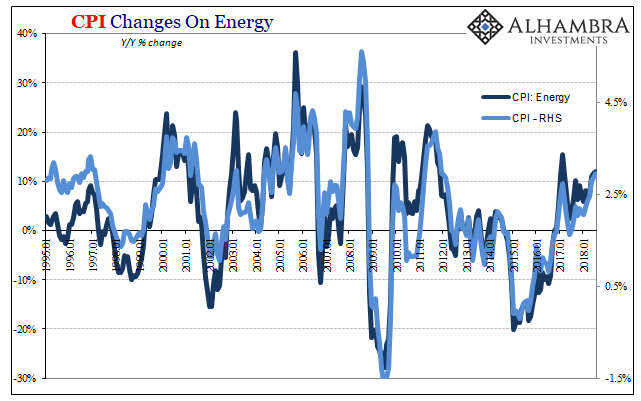
For one, the CPI remains wedded to little other than WTI. This late in 2018, even oil prices are more downward. They still contributed mightily to the annual headline inflation number, but only because of last year’s price. The CPI energy index was up by more than 11% for the third month in a row.
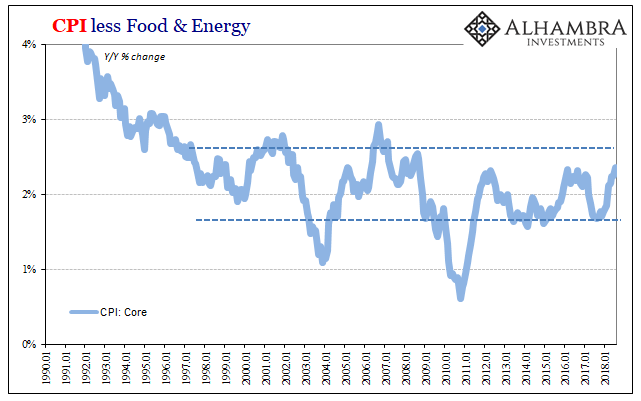
And while numerically the core CPI rate is higher than any other posted during the last decade, it isn’t materially so. It peaks only by a few bps above several other junctures that didn’t lead to anything other than false dawns.
In early 2012, the last generally comparable period to the current one, the core rate got up to 2.31%, only a few bps off the current reading. In February 2016, of all months, it was 2.33%. Neither of those represented a material difference for underlying inflation conditions, nor did history prove them to be.
This lack of follow-through is more visible in other “core” measures, such as price gains in services, or the so-called sticky buckets within the CPI (the latter which very closely matches the disappointing BLS data on wages).
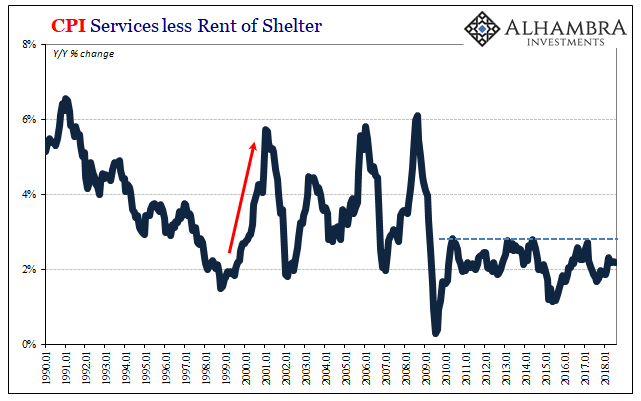
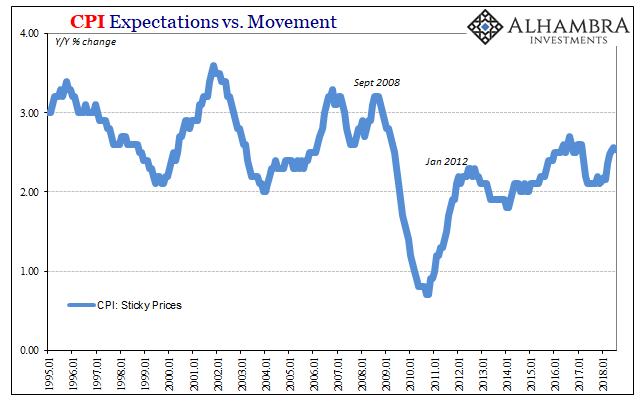
Perhaps that is why markets had taken to largely ignoring the CPI or the PCE Deflator. TIPS trading and therefore estimated break-even rates, a measure of inflation expectations, had moved slightly higher last year to get back to about the same levels as 2013-14. Despite this second oil-driven CPI spike, break-evens didn’t budge, a reluctance to chase WTI we’ve seen now four times over the past ten years.
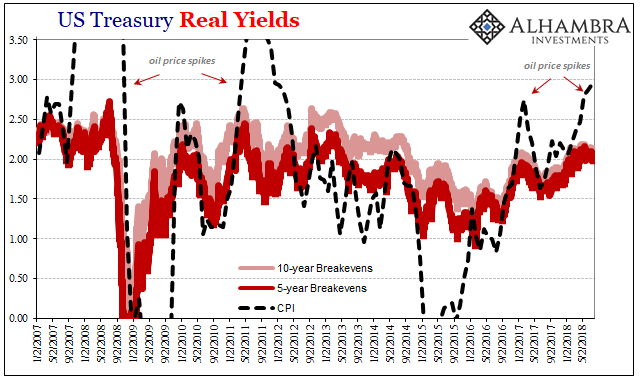
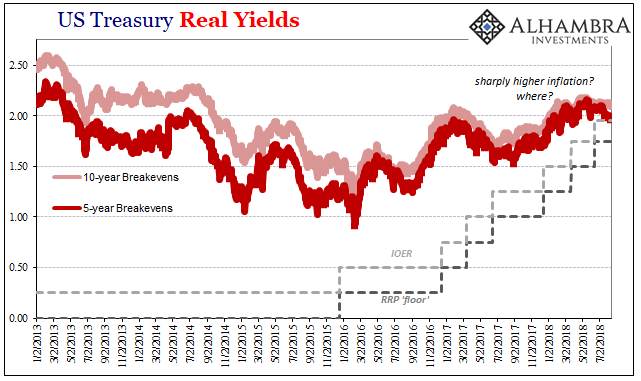
It appears that over the last month, even TIPS investors have begun to consider the other risks, those of deflation over inflation. The 5-year/5-year forward inflation rate has increased since early July – but only because the 5-year break-even has begun to fall despite now 2 straight months of the highest inflation since 2011.
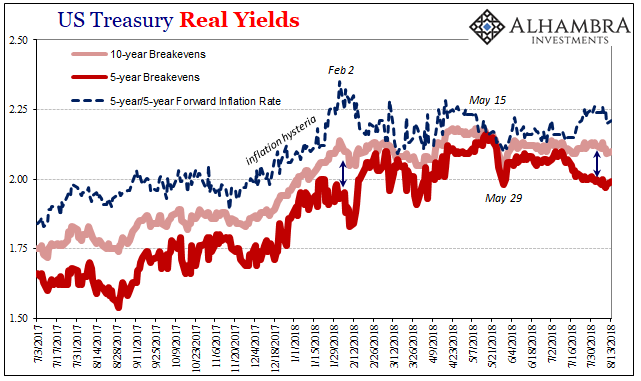
Inflation expectations in whichever time frame or maturity have largely stalled since February 2nd amidst worldwide global liquidations. Both break-evens but especially the 5-year is now suggesting a clear inflection during those two weeks between May 17 and May 29; the former date when the benchmark 10-year UST yield last registered its multi-year high and the latter the obliteration of that high under a worldwide “dollar” collateral call (deflationary).
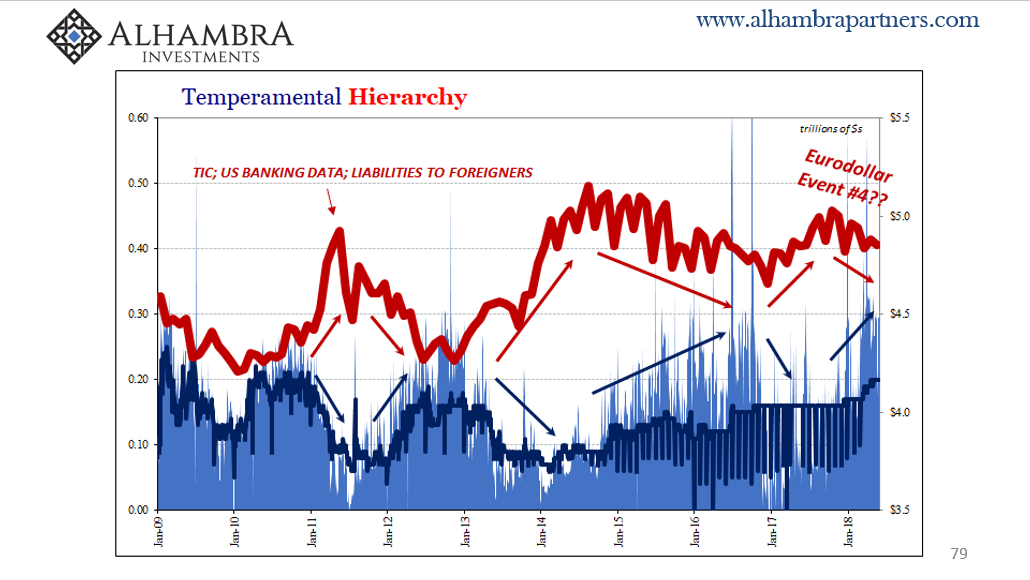
From the timing as well as the durability it seems the market is now looking past WTI-supported CPI’s and now toward what might happen if things continue on as they have since February. In other words, growing deflationary smoke if not yet full-blown eurodollar fire. Inflation expectations are rolling over just like 2011 with inflation indices at or near high points.
As with bond curves, reflation has increasingly disappeared. The lower 5-year break-even despite these CPI results is a clear signal that market perceptions have shifted if not sharply then at least seriously in that direction. Small wonder, too, since what happened earlier this year still hasn’t been adequately accounted for by the “strong” economy crowd (T-bills, really?) nor has it abated; in many places, eurodollar issues have grown demonstrably worse.
It leaves Jerome Powell clutching the wrong forecast for the Fed yet again. The trick for a real recovery has always been enough underlying strength, real strength, that inflation accelerates and remains that way. The US, as other global economies, has proven it can get there from time to time but can never stay there.
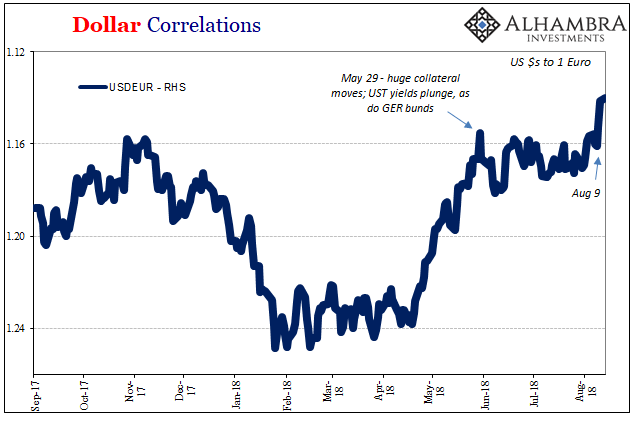
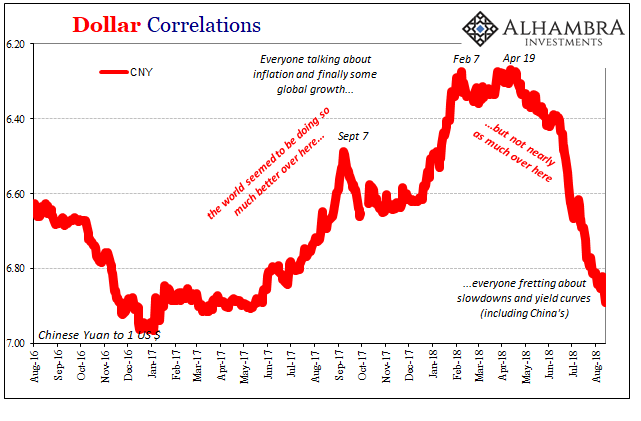
That’s this lost decade in a nutshell. It seems like it’s getting better, but it never really does get better. Just when you think it has turned the corner, eurodollar disruption all over again. TIPS markets despite the multi-year CPI and core CPI highs appear to recognize the substantial and growing risks of repetition.
Despite the hysteria, the balance never went too far toward inflation. Now it’s tipping back slightly toward deflation. It’s August, should we have really expected anything else?
