- US stocks finish best quarter in over 20 years
- Dollar flat
- Gold climbs to highest level since 2011
Key Events
US futures for the S&P 500, Dow Jones, NASDAQ and Russell 2000 edged lower on Wednesday, even as European shares ticked higher. Though the S&P 500 yesterday finished its best Q2 in more than 20 years, contracts on US indicies are wavering this morning as they start the new quarter with only mild optimism—pressured by warnings about the possibility of new COVID-19 cases to potentially double on a daily basis in the US, and mixed economic data.
Yields jumped; the VIX crawled higher. Gold and the yen surged.
Global Financial Affairs
Contracts on the S&P 500 took a step back today, even after Tuesday's Consumer Confidence release registered the biggest increase since 2011.
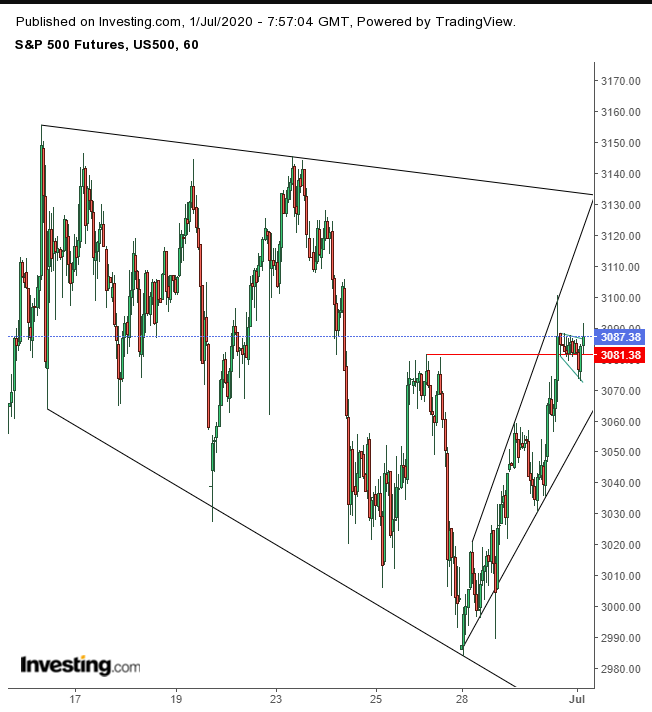
From a technical perspective, ES is testing the top of an hourly falling flag, bullish within the preceding 1.5% jump in the three hours that preceded the pause. The contract has been trending higher since the June 28 low, surpassing the June 26 peak. This makes traders' need for profit-taking and fresh blood to take over the uptrend understandable.
The next test will be where the longer-term downtrend meets the current rally, at 3,130, per the current angle of ascent.
A rally in oil and gas company shares pushed the Stoxx Europe 600 Index into a modest climb.
Most of Asia was positive, with China’s Shanghai Composite leading the region, (+1.4%), after the country's manufacturing activity improved in June, bolstering the view for a recovery from China’s sharpest decline since the 1960s.
Japan’s Nikkei 225 underperformed, (-0.75%), after sentiment among the country’s large manufacturers dropped to its lowest level during Q2 in more than 10 years as the coronavirus decimated exports and tourism, major components in Japan’s GDP.
US equities rallied during yesterday's New York session, sealing their best quarterly performance since 1998, as better-than-expected data kept alive the story of a quick recovery.
Adding to the risk-on mood, traders dumped Treasurys for a second day.
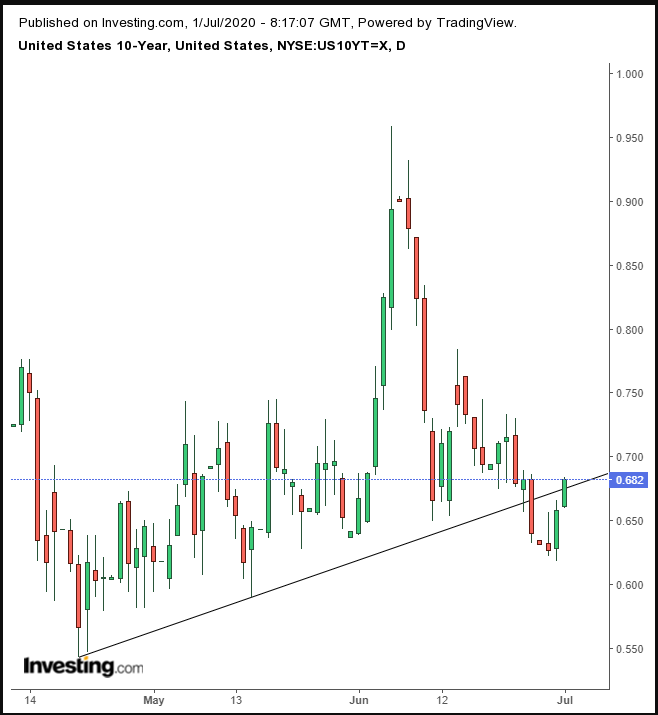
Yields, including for the benchmark 10-year Treasury, were pushed back above the uptrend line since April 21.
The VIX, however, indicates that investor fear remains active.
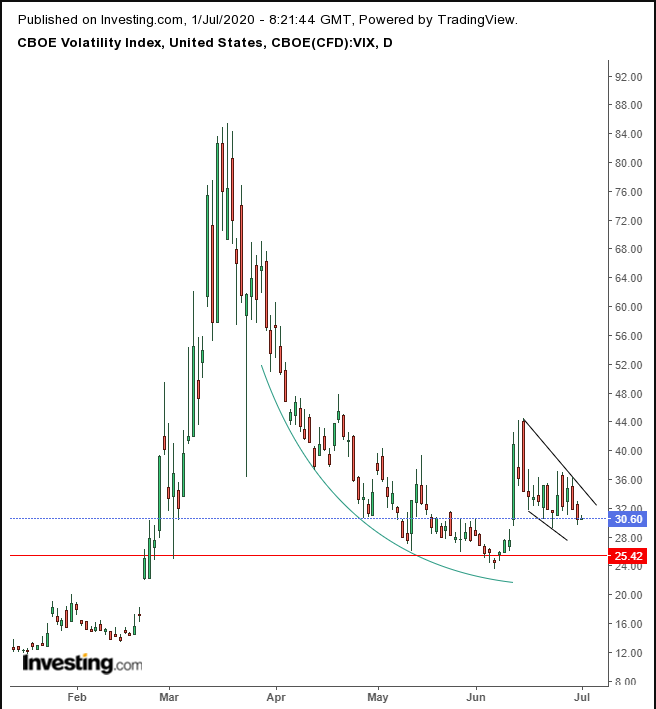
At 30.59, the 'fear' index hasn't calmed down, remaining steady at its highest level since May 19, well above 25, which was the highest level since January 2019. However, the momentum of the index has gradually been slowing since April.
It is currently within a falling flag formation. If the pattern illustrates the same dynamics as it does with stocks, and is not only a mirror image, we can expect another surge, following an upside breakout.
The dollar is once again falling, for a second day.
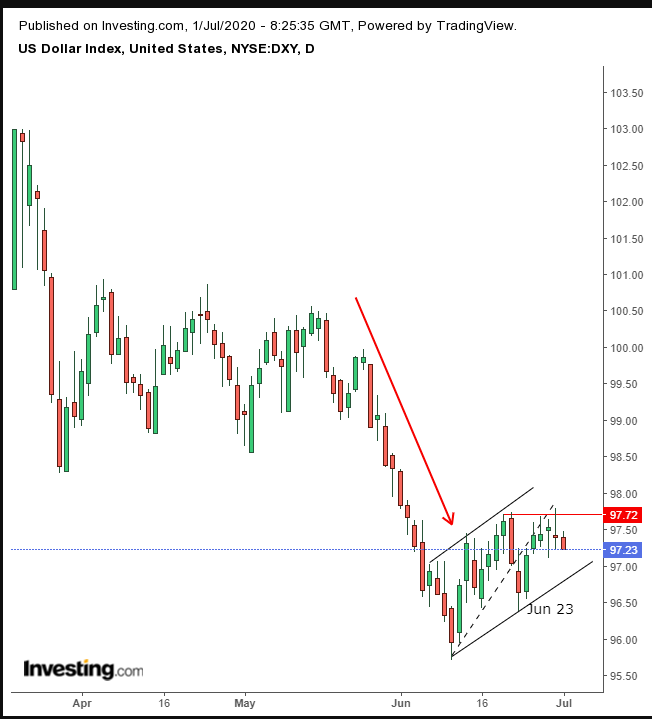
The DXY potenially completed a return move to a rising flag which—following the sharp, preceding plunge—sets up anticipation for another leg down with equal zeal. The only question is whether yesterday’s intraday price move, which posted a new high since the June low, renders the original flag (dotted line) moot. For the answer we must wait for a downside breakout of the new uptrend line being formed, connecting the June 23 low.
Gold has finally burst through the psychological $1,800 bar.
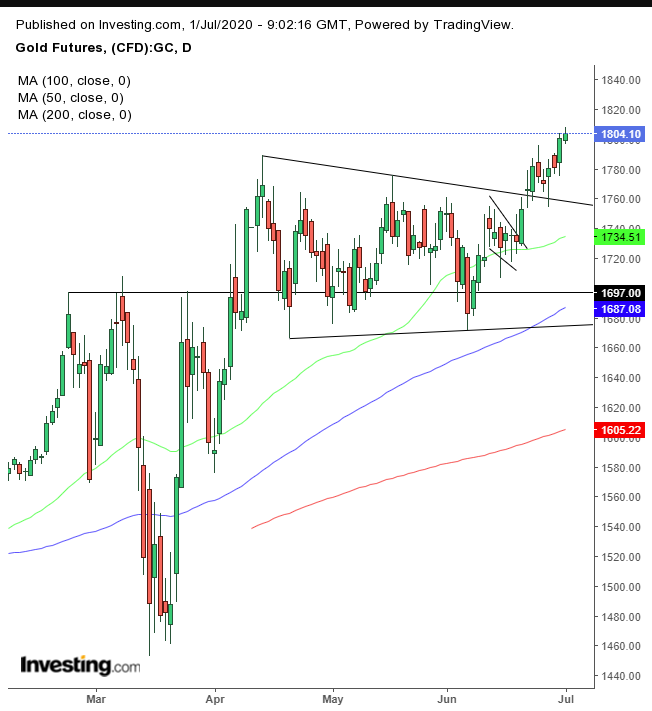
It's the first time since 2011 that the precious metal has hit that elevated level, actualizing a trifecta of bullish patterns: a predictive H&S / symmetrical triangle / falling flag.
Crude oil extended a rally following the close of its most profitable quarter in almost 30 years, after the first drawdown in American inventories since May.
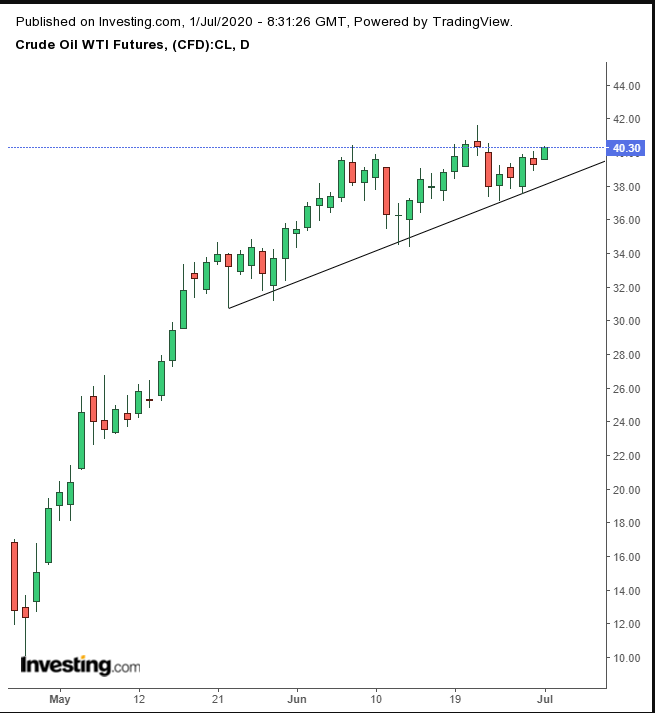
Technically, the congested advance since May raises a red flag. A dip below $38 may cause the price to top out.
Up Ahead
- US ISM Manufacturing PMI will be reported later today. It's expected to have improved since May.
- Nonfarm Payrolls figures will print on Thursday, one day earlier than usual ahead of the start of the July 4th holiday weekend, which begins Friday.
Market Moves
Stocks
- Futures on the S&P 500 Index decreased 0.1.
- The Stoxx Europe 600 Index gained 0.3%.
- Germany’s DAX rose 0.7%.
- The MSCI Asia Pacific Index dipped 0.1%.
Currencies
- The Dollar Index fell 0.1% to 97.26.
- The euro dipped 0.1% to $1.1224.
- The Japanese yen strengthened 0.3% to 107.64 per dollar.
- The British pound declined 0.1% to $1.2386.
Bonds
- The yield on 10-year Treasurys increased two basis points to 0.68%.
- Germany’s 10-year yield rose two basis points to -0.43%.
- Britain’s 10-year yield gained three basis points to 0.197%.
Commodities
- West Texas Intermediate crude increased 2.4% to $40.21 a barrel.
- Gold strengthened 0.4% to $1,787.73 an ounce.
