-
Global stocks hit new lows and enter downtrends on US-China trade retaliatory moves
-
Chinese shares reach two-year low
-
US futures plunge
-
However, US majors remain in an uptrend
-
Russell 2000 posts fresh record high
-
Yen ends short-term slump and resumes long-term uptrend
-
Oil pares gains ahead of OPEC meeting in Vienna this week
Key events
Global stocks and US futures on the S&P 500, Dow and NASDAQ 100 plunged in unison on Tuesday, roiled by US President Donald Trump's threats to slap tariffs on $200-billion worth of Chinese imports on top of the $50 billion levies confirmed on Friday.
The dollar strengthened, while US yields edged lower. The yen also slipped while gold was mostly flat.
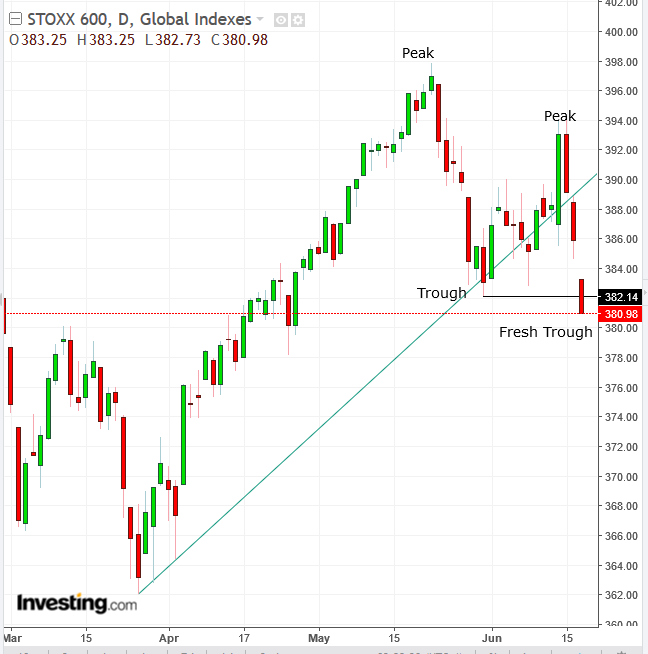
The STOXX 600 opened 0.7% in negative territory and later extended its losses to a full percentage point, hitting an aggregate, three-day retreat of 2.8 percent, reaching its lowest level since April 26. Technically, the pan-European benchmark posted a trough lower than the previous, May 31, 382.14, which marks a trend reversal from up to down.
The European stock index trend reversal follows heavy losses earlier today during the Asian session, triggering technical signals and completing bearish patterns for most of the regional benchmarks.
Japan’s TOPIX suffered a second straight day of declines, including falling gaps; the index tumbled 1.5 percent, for a total two-day loss of 2.5 percent. As well, it closed at the bottom of the session. Technically, the price crossed below an uptrend line in place since late March, falling below the 200 DMA.
Chinese shares, however, were hit the hardest. The Shanghai Composite was pressured by geopolitical jitters—China is a central participant in Trump's trade war—as well as technicals: the degree of loss as well as the significance of its supply/demand balance. The mainland index tumbled 3.8 percent, stretching losses to a four-day slide totaling 5.6 percent and reaching a two-year low. On a weekly basis, the index hit a five-straight week decline of 8.95 percent.
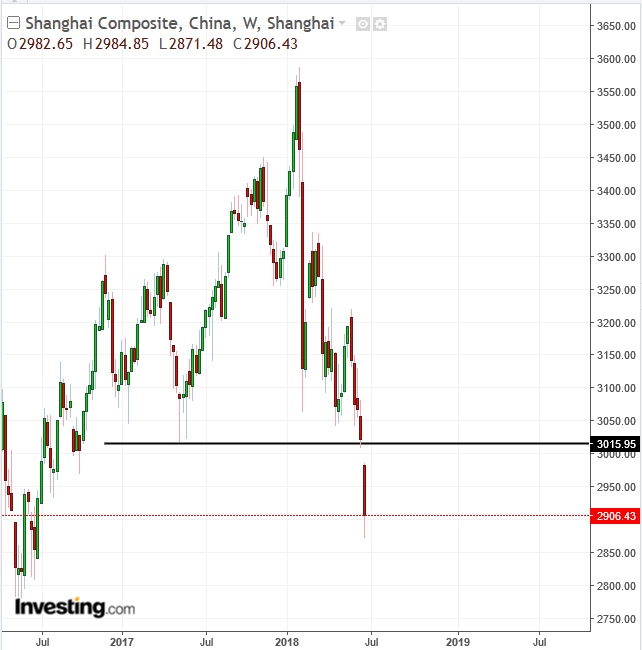
From a technical perspective, the index price has slipped lower with a breakaway falling gap. This occurs when everyone wants to sell, but no one wants to buy at these price levels. A breakaway gap suggests that all demand has been absorbed and bears are overrunning bulls. Finally, after the 3,000 level has propped up by demand at these levels since April 16, a support line since January 2017, the line has been broken, establishing a long-term downtrend.
Hong Kong’s Hang Seng slumped 2.95 percent, with a breakaway gap, reaching a four-day plunge of 5.45 percent. It then recovered modestly, with the lowest close since Feb. 12 and less than 0.1 away from December 21 close. Technically, the move completed a symmetrical triangle, suggesting a repeat of the double-digit, February correction.
South Korea’s KOSPI lost 1.5 percent for a total five-day decline of 5.25 percent. The price hit its lowest level since September, after completing a Complex H&S top reversal.
Australia’s S&P/ASX 200 bucked the region's forceful downtrend, closing around neutral levels, after giving up a 0.7 percent gain. As reported yesterday, the ongoing ascent of bank and real estate shares is offsetting losses in the materials sector—the main casualty of vexing trade tariffs.
Technically, the retrenchment from earlier gains seen in the Aussie benchmark formed a powerful shooting star, which underscores a bullish failure. The move also coincides with a price level that has triggered selling since January, confirming the resistance. Should the negative scenario heralded by the shooting star formation materialize, it may lead to a small, double-top reversal.
Global Financial Affairs
The risk-off mood pervading global markets stemmed from the quick escalation of the trade spat between the US and China, with both countries pressing ahead to implement reciprocal tariffs last week. Trump said yesterday he could add another 10 percent levy on an expanded list of Chinese goods if China's government refuses to backtrack from its tariff plans—a move that promises to prompt a new tariff announcement from China in return.
Does this mean we're heading for a recession? We don’t think so. While the Chinese economy is showing multiple signs of a dramatic slowdown (shortly after Germany also posted disappointing growth figures), the US is still charging full-steam ahead. That’s what Fed Chair Jerome Powell pointed out after the FOMC monetary policy meeting last Wednesday. Moreover, while China's currency and equities are in a free fall, the dollar continues to gain ground and US stocks have so far shown resilience against all the multiple headwinds that hit global markets last week.
And while the STOXX Europe and Japan’s TOPIX slipped 0.85 percent and 0.96 percent respectively on Monday, the S&P 500 turned a 0.8 percent drop into a limited 0.2 percent retreat during the US session. Even the Dow Jones Industrial Average, the benchmark most sensitive to trade tariffs, yesterday came back from a full percentage point plunge, closing at a much more modest decline of 0.4 percent.
The NASDAQ Composite also gained ground and the Russell 2000, whose listed small cap companies are unaffected by a potential collapse in demand from Chinese buyers, climbed 0.55 percent, posting a fresh record, both on a closing and a high basis.
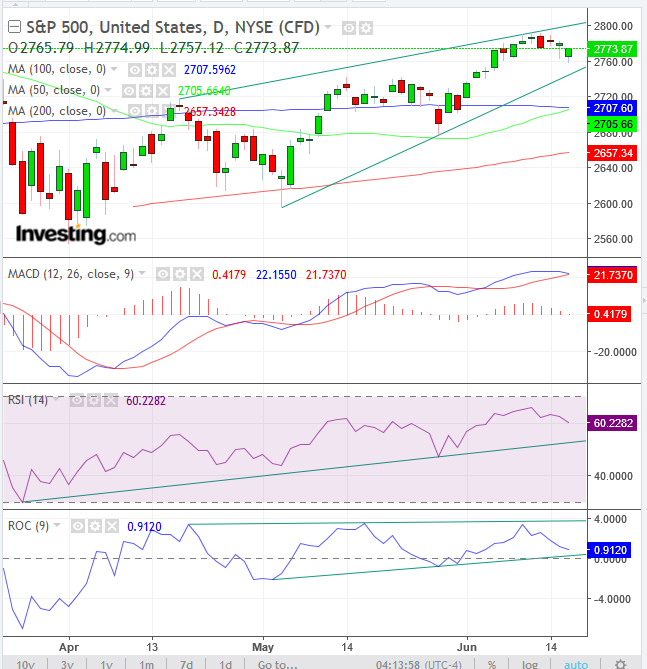
For now, the S&P 500 remains in an uptrend, but the heavy slump seen this morning across US futures shows the downbeat global sentiment is affecting traders.
The SPX trading pattern since mid-April has posted a rising wedge, which represents a bearish pattern, completed with a downside breakout. This occurs when a buying frenzy runs out. Multiple technical indicators are also on the verge of either finding support or reversing. The 2,700 may be the line in the sand.
For now, we expect a correction, which should run until US investors find some other element (most likely, economic data) to hold on to while the geopolitical roller coaster continues in the background.
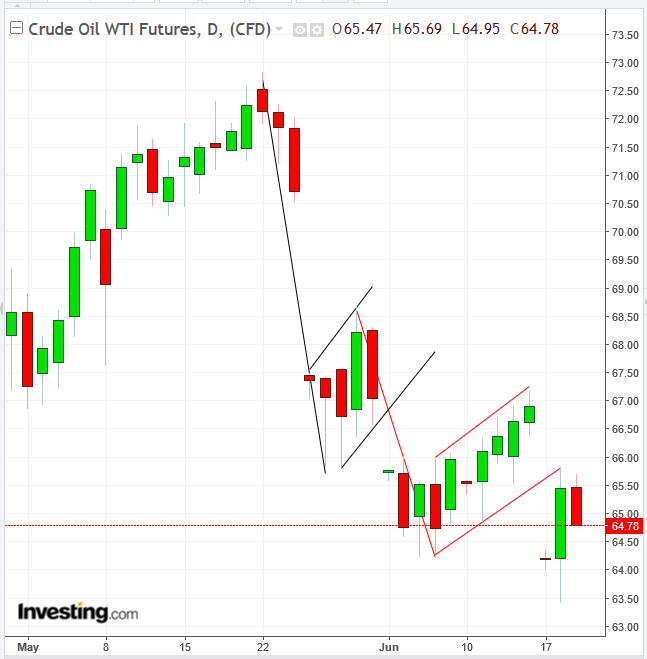
In other news, oil edged lower alongside other commodities. The WTI price pared Monday’s gains as traders weighed discussions among OPEC oil-producing countries, over increasing global output, ahead of a meeting in Vienna this Friday. Technically, yesterday’s 2.4 percent intraday jump hit the bottom of a rising flag and immediately retreated to pare the advance to 1.9 percent.
Today’s continued retreat suggests yesterday’s advance was a complete return move, which demonstrated the integrity of the pattern and points to further declines ahead.
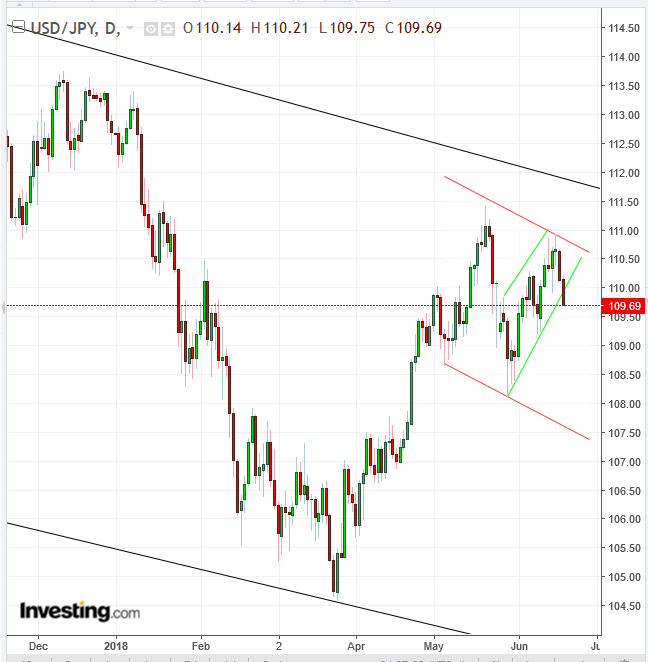
The yen advanced for a second day amid the selloff, pushing the USD/JPY pair to cross below the short-term uptrend since May 30, where it's now trading at the bottom of the session, suggesting a continuation of the mid-term downtrend since early May, within the longer-term downtrend since January 2017.
Up Ahead
-
Fresh data on US housing starts is set to show a pick up in May.
-
Fed Chair Jerome Powell, ECB President Mario Draghi and other central bankers are to speak on a panel on policy in Sintra, Portugal.
-
Existing Home Sales will be published at 10:00
-
Thailand, Philippines and Brazil central bank decisions are due Wednesday.
-
Bank of England rate decision comes out on Thursday.
-
Also on Thursday, US job claims and Philadelphia Fed Manufacturing Index are reported.
-
On Friday, German Manufacturing PMI will show whether Europe’s steam engine is really slowing down.
Market Moves
Stocks
-
The STOXX Europe 600 dipped 0.8 percent, to the lowest level in almost eight weeks.
-
Futures on the S&P 500 sank 1.3 percent to the lowest level in more than two weeks on the biggest tumble in eight weeks.
-
The UK’s FTSE 100 dropped 0.8 percent to the lowest level in six weeks.
-
Germany’s DAX declined 1.4 percent to the lowest level in more than a week on the biggest drop in almost three weeks.
-
The MSCI Emerging Market Index sank 2 percent, hitting the lowest level in more than eight months with its fifth straight decline and the largest tumble in more than 12 weeks.
-
The MSCI Asia Pacific Index plunged 1.5 percent, reaching the lowest level in more than six months on its fifth consecutive decline and the biggest tumble in almost 12 weeks.
Currencies
-
The Dollar Index gained 0.32 percent to 94.98, set for the highest close since July 12, 2017.
-
The euro fell 0.4 percent to $1.1578.
-
The British pound declined 0.3 percent to $1.3204, the weakest level in seven months.
-
The Japanese yen jumped 0.8 percent to 109.65 per dollar, the strongest level in more than a week on the biggest increase in almost four months.
-
The Turkish lira sank 1 percent to 4.7521 per dollar, the weakest level on record.
Bonds
-
The yield on 10-year Treasuries lost six basis points to 2.86 percent, the lowest level in almost three weeks on the biggest decrease in three weeks.
-
Germany’s 10-year yield slipped four basis points to 0.36 percent, hitting the lowest level in almost three weeks with its sixth straight decline.
-
Britain’s 10-year yield gave up five basis points to 1.324 percent, reaching the lowest level in almost three weeks on its sixth straight decline and the biggest decrease in three weeks.
-
Italy’s 10-year yield advanced four basis points to 2.594 percent, the first advance in a week and the largest gain in more than a week.
Commodities
-
West Texas Intermediate crude fell 1 percent to $65.20 a barrel.
-
Gold gained 0.2 percent to $1,280.84 an ounce.
-
Brent crude lost 0.9 percent to $74.63 a barrel.
