Small losses in equity markets in Europe look like being replicated in the US ahead of the open on Wednesday, as indices continue to struggle at their highs.
Equity rally stalling at record highs again
The rally in US equity markets has stalled over the last couple of months as the Trump reflation trade began to run out of steam. The last few weeks though has seen the bullish momentum pick up, sending the S&P and Dow back towards their record highs but once again we seem to be stalling at these levels. As long as we stay above 20,815 in the Dow and 2,378 in the S&P 500, then momentum will appear to remain with the bulls but a break below would suggest the trading range of the last couple of months remains intact.


Pick your poison: What is the Market Focusing On?
USD pares gains but rebounds again early in European session
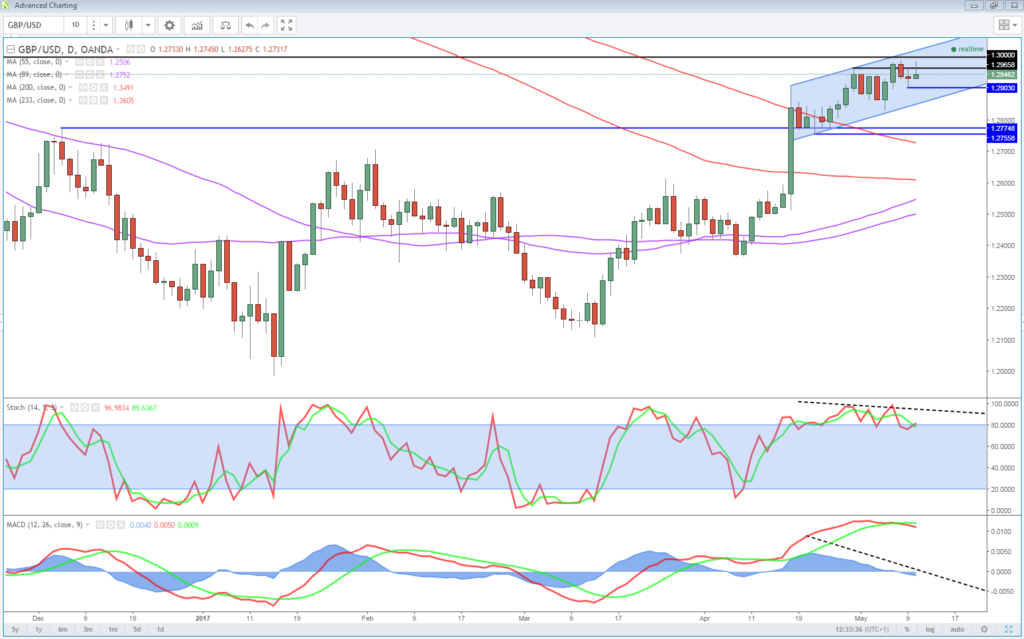
The US dollar pared gains overnight following two positive days at the start of the week but it has rebounded again at the start of the European session. The rebound came just as GBP/USD was testing 1.30, an important technical level for the pair. With the pair having now come off its highs and the dollar appearing to gain momentum, the next test may come from below, with 1.29 being a potentially important level.

EIA inventory numbers key after oil decline as API reports large decline
Oil is trading around 1% higher today as we await inventory data from EIA. Brent and WTI sold off heavily towards the back end of last week, breaking below $50 and $47.50, respectively, in the process, in a sign that efforts by OPEC and non-OPEC producers to cut output are proving insufficient. With both having now stabilised just below these technically important levels, it will be interesting to see whether today’s EIA release will be the catalyst for a move back above or the trigger for further another move lower.
On Tuesday, API reported a larger than expected inventory drawdown of 5.78 million barrels, confirmation of which by EIA today would be well above the 1.786 million that markets are expecting. With the reaction to Tuesday’s API data being relatively mild, there is there potential for upside if EIA confirms the numbers but with markets showing a reluctance to do so on Tuesday, I wonder whether it would be enough to break $50 in Brent.


Which stock should you buy in your very next trade?
AI computing powers are changing the stock market. Investing.com's ProPicks AI includes 6 winning stock portfolios chosen by our advanced AI. In 2024 alone, ProPicks AI identified 2 stocks that surged over 150%, 4 additional stocks that leaped over 30%, and 3 more that climbed over 25%. Which stock will be the next to soar?
Unlock ProPicks AI