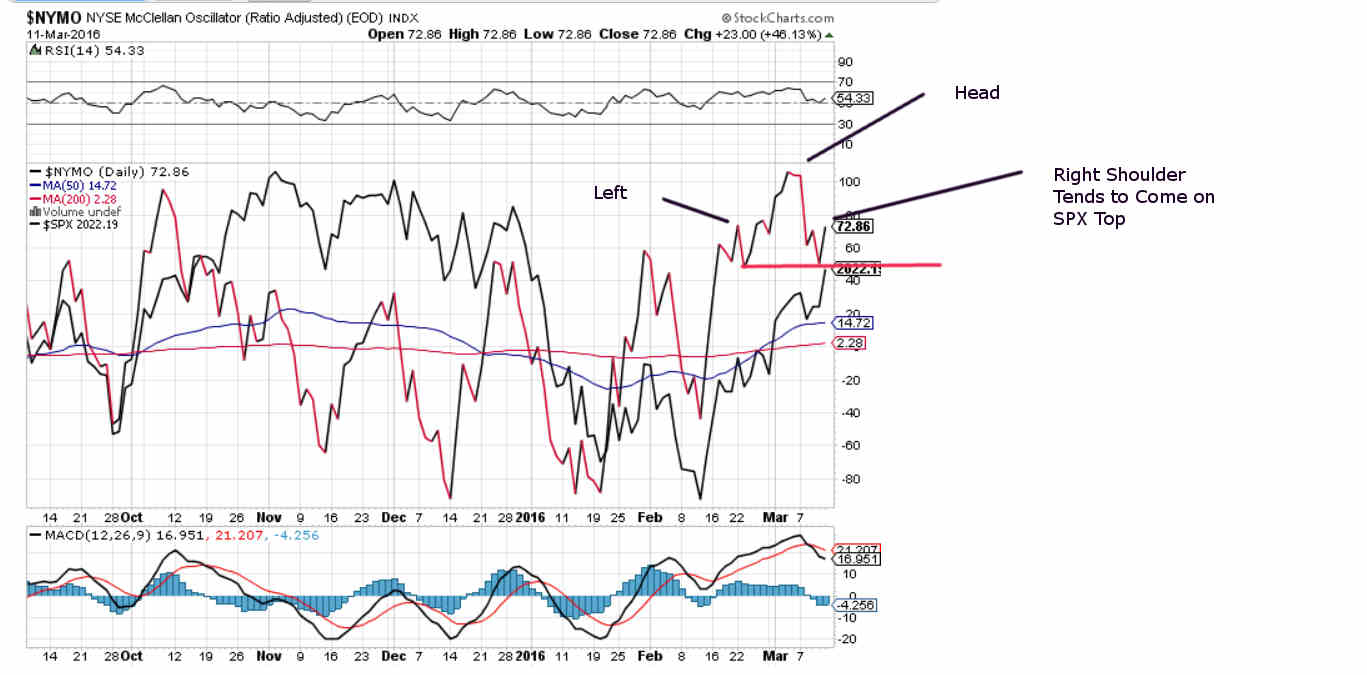
A Head and Shoulders has Formed on NYMO
NYMO has formed a head and shoulders, with the right shoulder a divergence from an SPX higher price high. You tend to see this before dips, especially after a NYMO close at 100+.
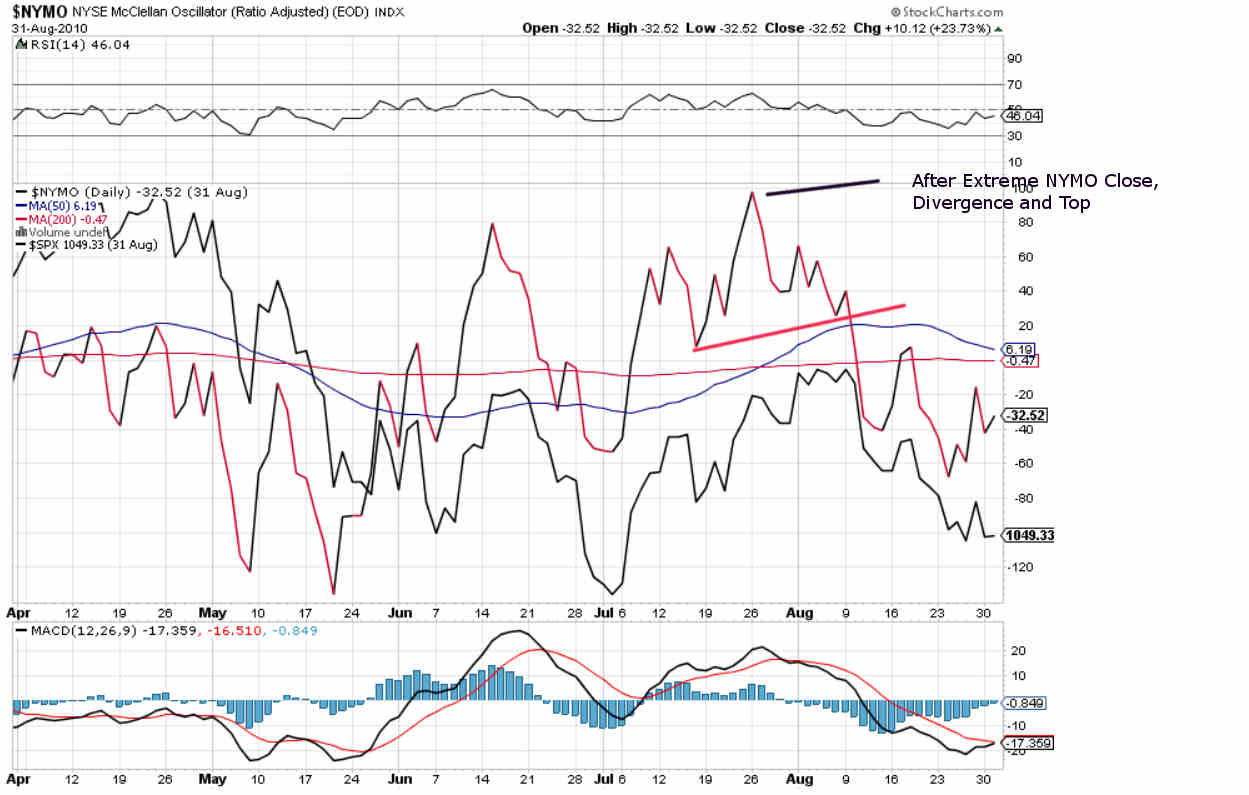
NYMO H&S After 100+ Close at the Top of a Big Megaphone Wave
Above is another NYMO head and shoulders completing after a close at 100+. This right shoulder occurred at the top of a big megaphone wave in the SPX.
Note that the SPX is working on a wave up within a big megaphone right now.
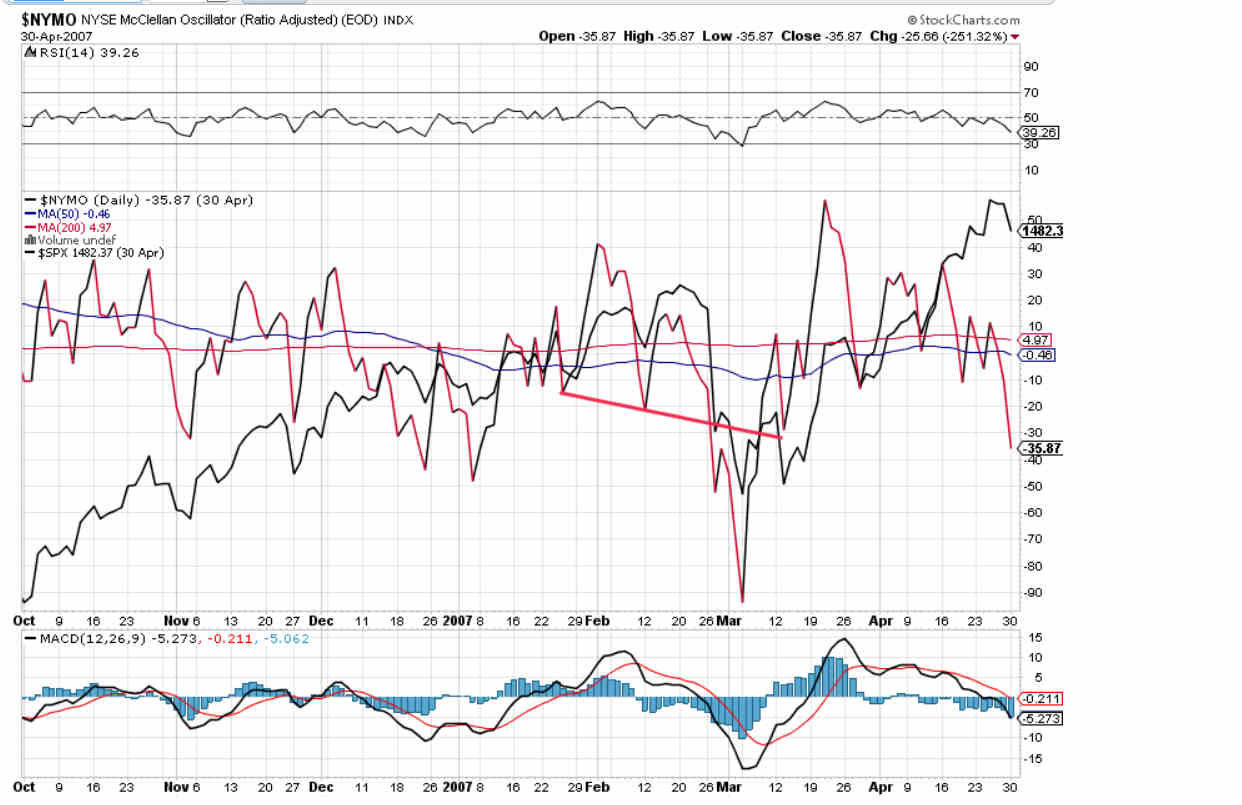
Another NYMO Head and Shoulders at the Top of a Big Megaphone Wave
Above is another example of a NYMO head and shoulders from early 2007. This right shoulder occurred at the top of a megaphone wave as well, although the megaphone wasn’t yet confirmed.
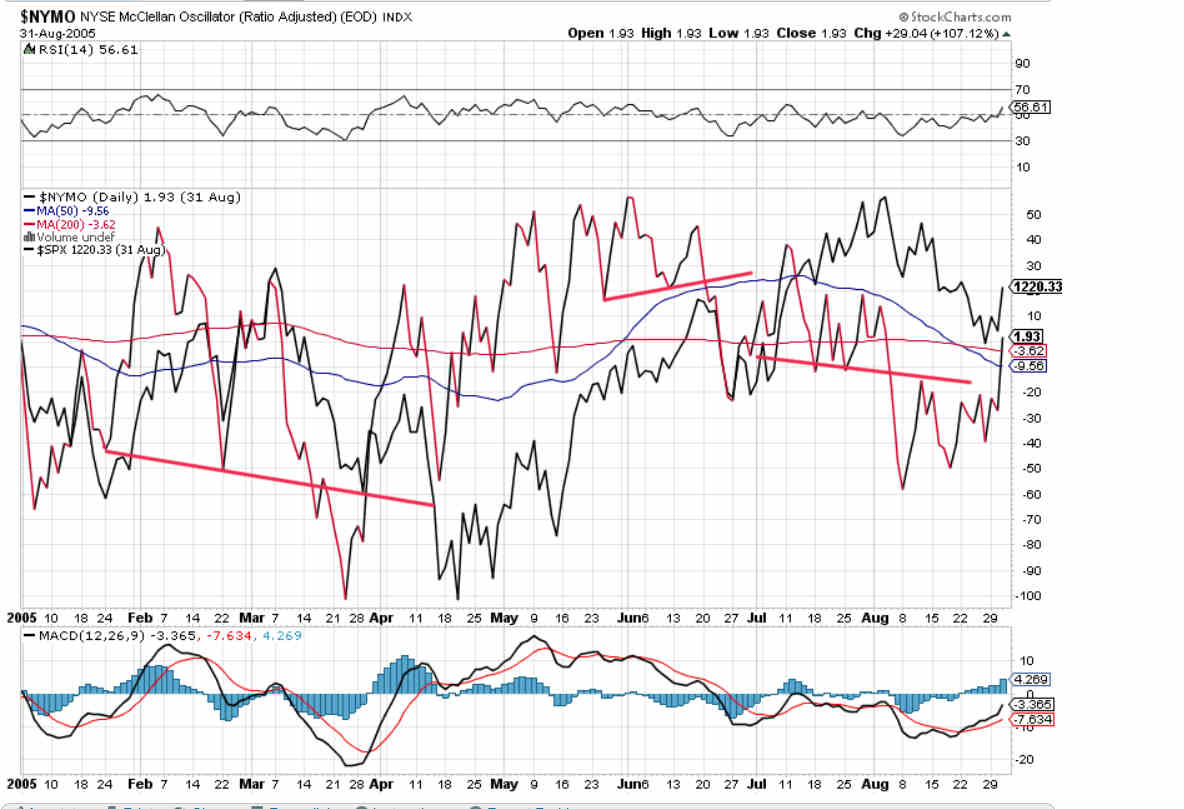
There are Three NYMO Head and Shoulders Tops on this Chart
The chart above contains three NYMO H&S tops. Note that while NYMO head and shoulders formations target coming NYMO lows pretty well using classic H&S measuring rules, the patterns don’t tell you much about the likely size of the coming price dip–you have to come up with actual price targets another way.
Also, note that if a NYMO H&S is too large to get to its target, it’s probably going to turn out to be part of a big NYMO megaphone.
Note also the lower H&S in July after the higher one in May and June. That kind of divergence tends to mean a bigger dip is coming. In this case, the market turned down into a bigger dip at the beginning of August and ended up taking the price down to below the June dip.
This is another set-up you see in big long-term megaphones.
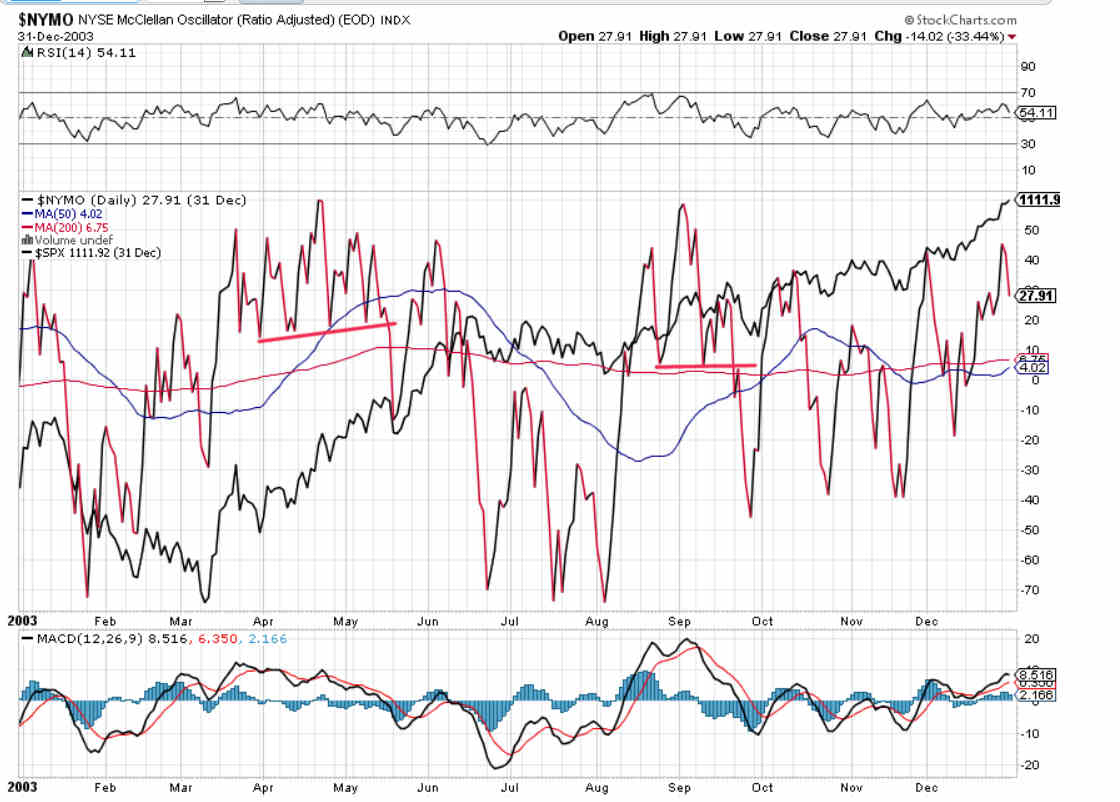
A Small Price Dip after a NYMO H&S is Usually a Warning
A NYMO head and shoulders can also serve as a set-up to get long. Once NYMO reaches roughly its H&S target, the price dip is probably over, even if it was very small.
If you see a moderate sized NYMO H&S that results in only a small price dip, get long on a new price high. A small price dip after a NYMO H&S is often a sign that the price is heading into a major melt-up.
Sometimes you’ll see a new price high without NYMO having broken its H&S neckline. That usually happens when NYMO is forming a triangle right shoulder on its H&S. In this case, get ready to short as the NYMO triangle completes. Often in these set-ups the final wave up of the triangle right shoulder is extremely small.
Which stock should you buy in your very next trade?
With valuations skyrocketing in 2024, many investors are uneasy putting more money into stocks. Unsure where to invest next? Get access to our proven portfolios and discover high-potential opportunities.
In 2024 alone, ProPicks AI identified 2 stocks that surged over 150%, 4 additional stocks that leaped over 30%, and 3 more that climbed over 25%. That's an impressive track record.
With portfolios tailored for Dow stocks, S&P stocks, Tech stocks, and Mid Cap stocks, you can explore various wealth-building strategies.
