Bitcoin price today: inks new record high near $119k as ETF inflows surge
Last week in the Macro Week in Review/Preview I wrote: Crude Oil broke the short consolidation lower early in the week before confirming a Hammer reversal higher and holding it to close. The RSI on the daily chart also turned back higher with the MACD starting to improve. The weekly view shows a Hammer formed needing confirmation next week with the RSI holding in bullish territory but the MACD fading. Divergence between timeframes. Resistance higher is found at 93 and 97 before 100. Above that is firmly bullish. Support lies at 91 and 88 with a break below looking bearish and support at 84 below. Seeking confirmation of return to uptrend.
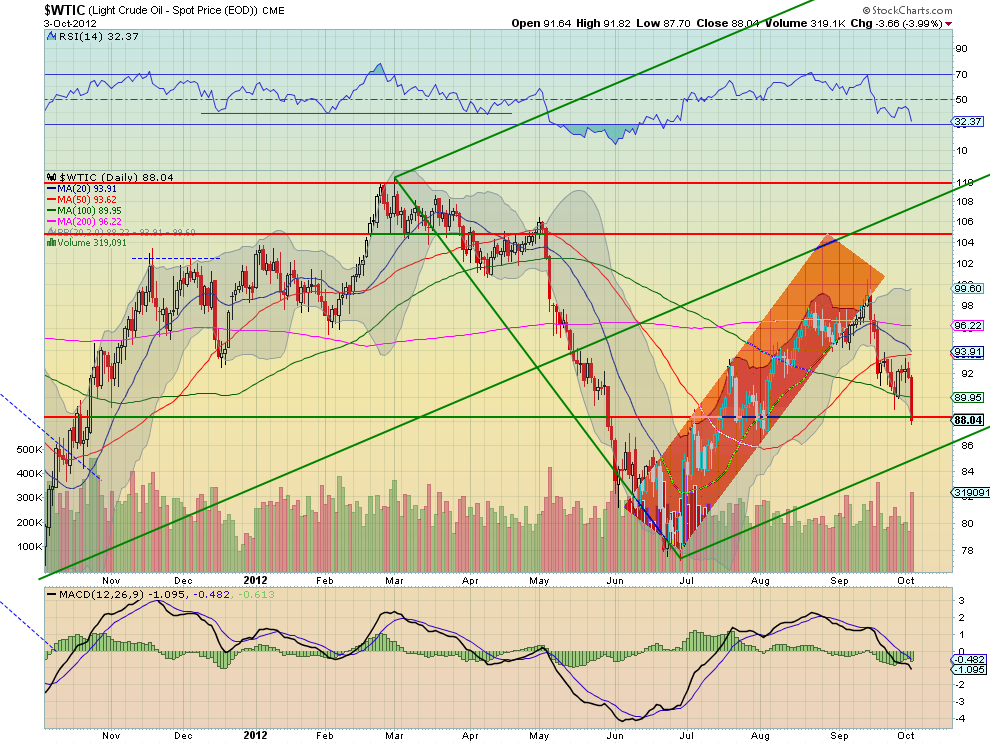
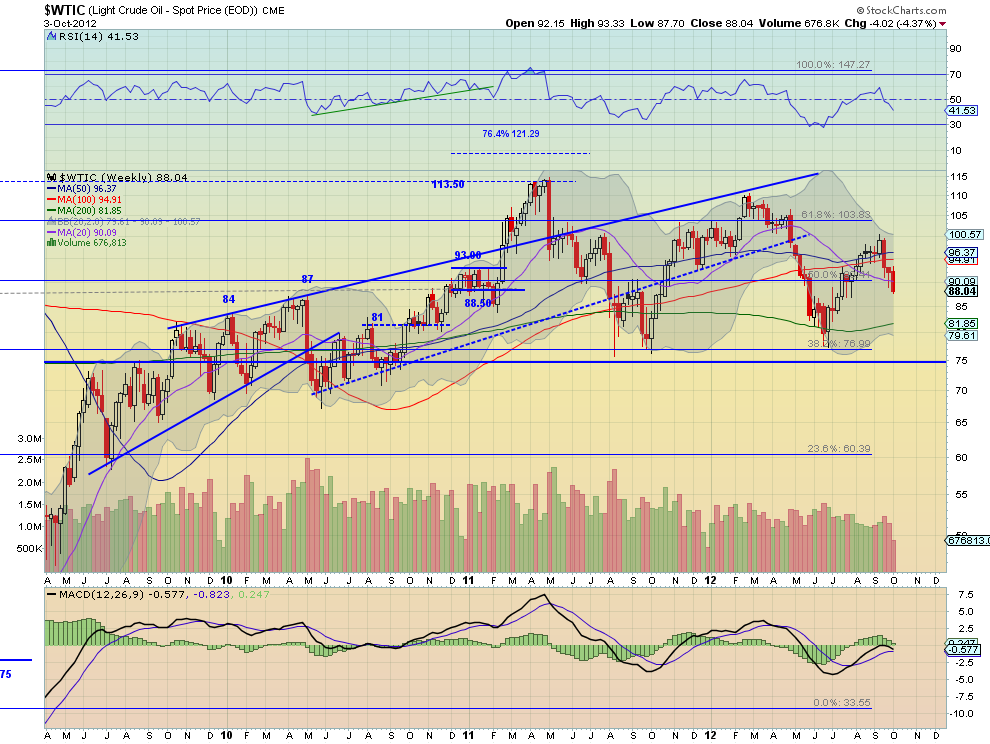
The daily chart above shows that Wednesday gave a strong statement that the confirmation higher is not coming any time soon. The daily chart shows a sharp drop to long term support/resistance at 88 with a target on the Measured Move lower now at 84, the support listed above. It is the weekly chart though that has a big change of sentiment from the weekend. With two days to go in the week the Hammer from last week is not confirming higher, but there is continuation lower and the target on the Measured Move now takes it to 71. 
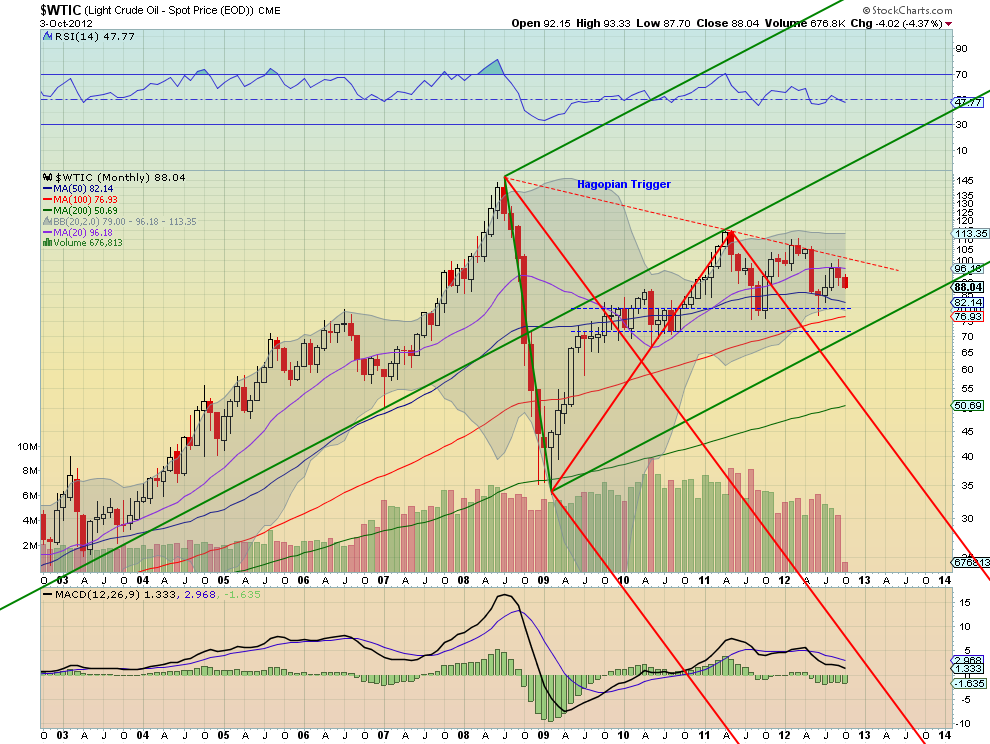
There is the support at 76.99 that has stopped it twice along the way which could help. But oddly enough, despite the clear trend lower in the daily and weekly charts the monthly view is still neutral. It will take a move below 80 to move it to bearish.
Crude Oil is again approaching the Hagopian Trigger line for a move to bullish after retesting the support at 80. Last month moving lower it is being attracted to the Lower Median Line of the bullish Pitchfork and forming a descending triangle. There is resistance at 97 and 108 followed by 114. Over 100 would create a bullish bias. Above that the target from the triangle break would take it to 134. Consolidation with a bias higher.
Disclaimer: The information in this blog post represents my own opinions and does not contain a recommendation for any particular security or investment. I or my affiliates may hold positions or other interests in securities mentioned in the Blog, please see my Disclaimer page for my full disclaimer.
Original post
Which stock should you buy in your very next trade?
AI computing powers are changing the stock market. Investing.com's ProPicks AI includes 6 winning stock portfolios chosen by our advanced AI. In 2024 alone, ProPicks AI identified 2 stocks that surged over 150%, 4 additional stocks that leaped over 30%, and 3 more that climbed over 25%. Which stock will be the next to soar?
Unlock ProPicks AI