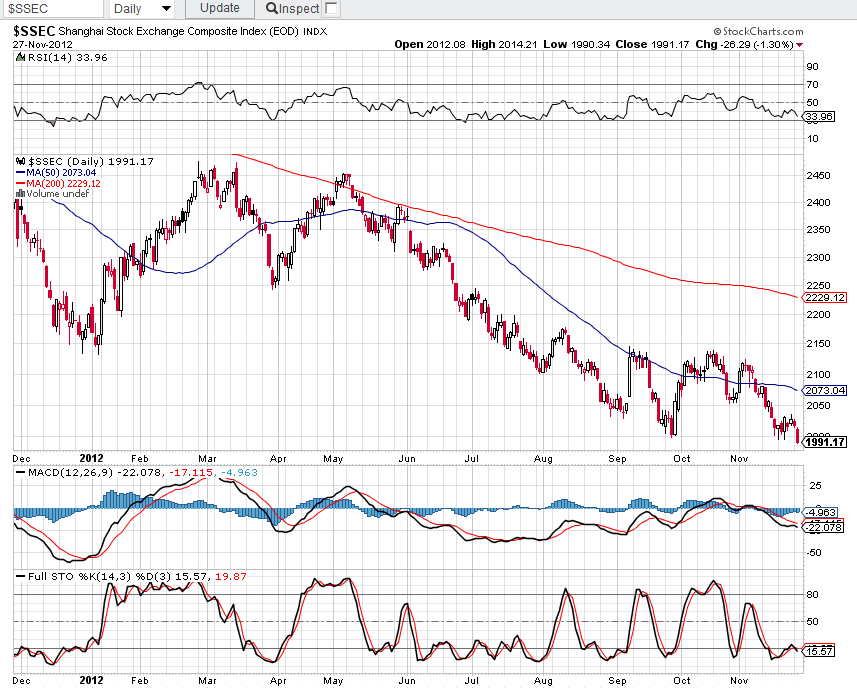
China's Shanghai Index closed yesterday at a new low not seen since February 2009. The 1-year Daily chart below shows that price slipped and closed just below near-term support as the RSI, MACD, and Stochastics indicators turned down again, with the MACD histogram beginning to accelerate below zero again.
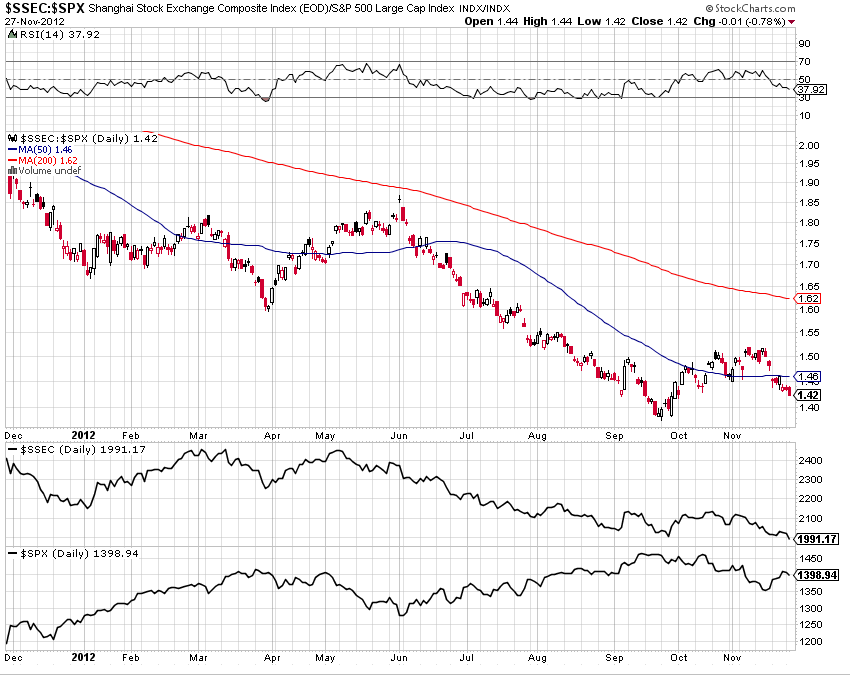
The next chart is a Daily ratio chart comparing the Shanghai Index with the S&P 500 Index. What I notice is that price on the Shanghai Index has held up a bit better than the S&P 500 inasmuch as the SSEC began to rally in late September, while the SPX has been in a slow decline since then. Prices have not made a new low for the year on this ratio chart.
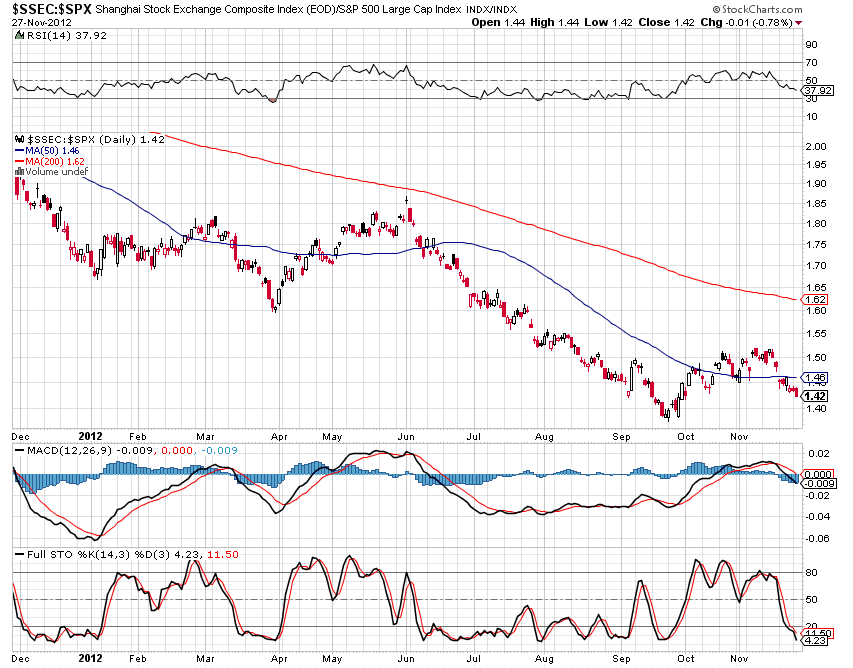
The next chart is the same ratio chart, but with the RSI, MACD, and Stochastics indicators added. As with the first chart, these indicators are still in decline, and the MACD histogram's decline is still accelerating...
signs of recent comparative weakness of the SSEC to the SPX.
The 1-year percentage comparison chart below shows the net gains to date on the SPX versus the net losses on the SSEC. 
The next percentage comparison chart below shows the net gains from November 7th to date on the SPX versus the net losses on the SSEC. While the SPX is attempting to rally from its recent lows, the SSEC has continued to decline and make a new (nearly) four-year low in the process. This chart is reflecting the recent comparative weakness of the SSEC to the SPX, as shown on the third chart above.
Whether this is the beginning of a new leg down on the Shanghai Index remains to be seen, but with downside momentum accelerating again and the other indicators turning down, it would appear that it may be starting Alternatively, this may be the low point for 2012, China's Year of the Water Dragon, as I wrote about on January 4th of this year, to, finally, begin a rally into next year.
This is one to watch over the next days/weeks, along with its performance against the S&P 500 Index. It's my guess that if European Indices fail to advance with confidence in the near term, we'll likely see further weakness in the SSEC.
Which stock should you buy in your very next trade?
AI computing powers are changing the stock market. Investing.com's ProPicks AI includes 6 winning stock portfolios chosen by our advanced AI. In 2024 alone, ProPicks AI identified 2 stocks that surged over 150%, 4 additional stocks that leaped over 30%, and 3 more that climbed over 25%. Which stock will be the next to soar?
Unlock ProPicks AI