
On March 16, 2019, the price of NEO (NEO) made a high near $10. It has been on a gradual downtrend since. Signs of strength, however, suggest a possible upward movement.
When could price increases begin? How high might they get?
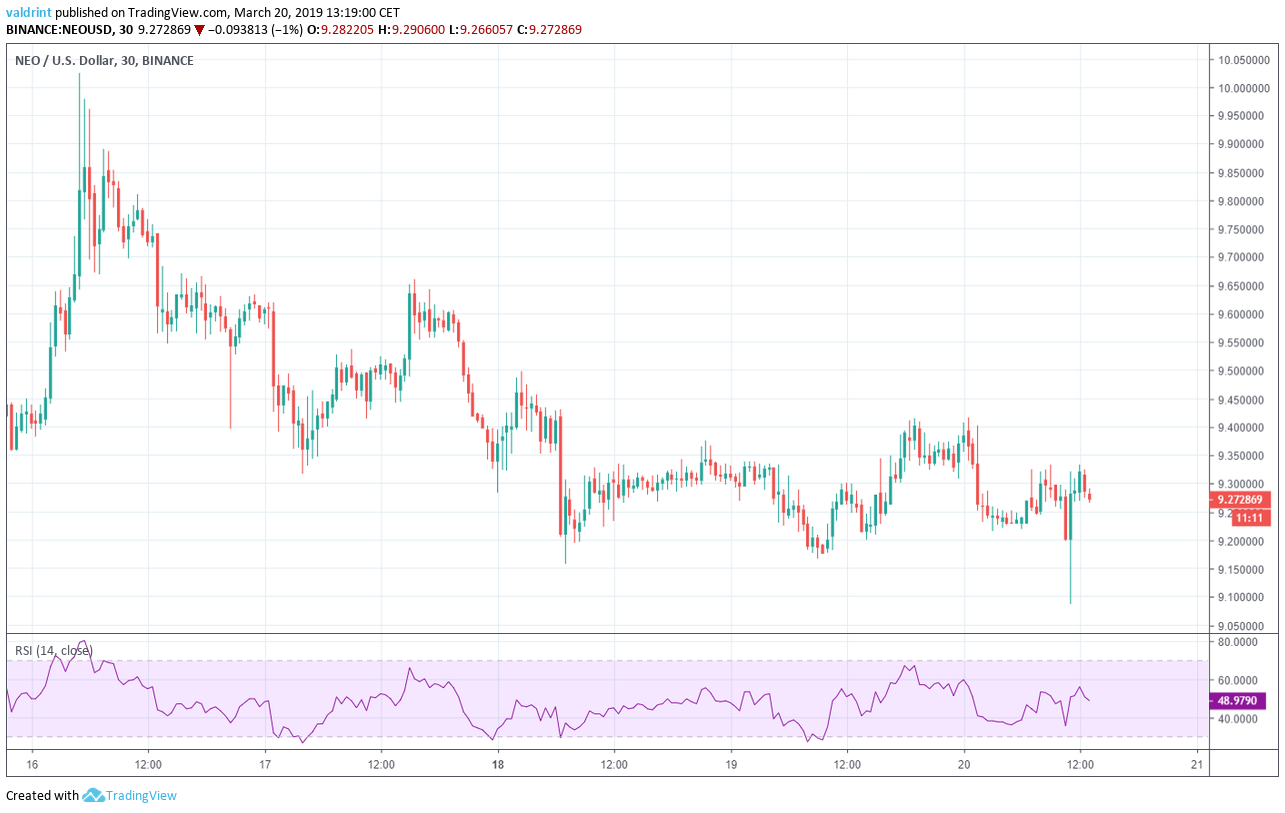 Graph: NEO Price and RSI between Mar 16 and 20, 2019.
In our Mar 14 analysis of NEO, we predicted that slight price increases with a rapid upward or downward movement possible.
After experiencing slight increases, the price of NEO made a rapid upward move on Mar 15 which continued into March 16. Prices have gradually decreased since. Over the longer term, however, NEO has experienced gradual price increases.
Based on today’s analysis, it is likely that NEO’s price increases at a steady rate for the long term period. During this period of growth, volatility is still likely.
NEO (NEO): Trends and Highlights for March 20, 2019
- The price has been on a downtrend since Mar 16.
- It recently broke out from the resistance line.
- There is bullish divergence developing in the RSI.
- There are resistance areas near $10 and $10.8.
- There are support areas near $9 and $8.5.
Previous Resistance
The price of NEO on Binance is analyzed at thirty-minute intervals from Mar 16 to Mar 20.
The price made a high of $10.02 on Mar 16. A sharp drop ensued. Price made another lower high of $9.66 on Mar 17. Tracing these highs gives us a descending resistance line.
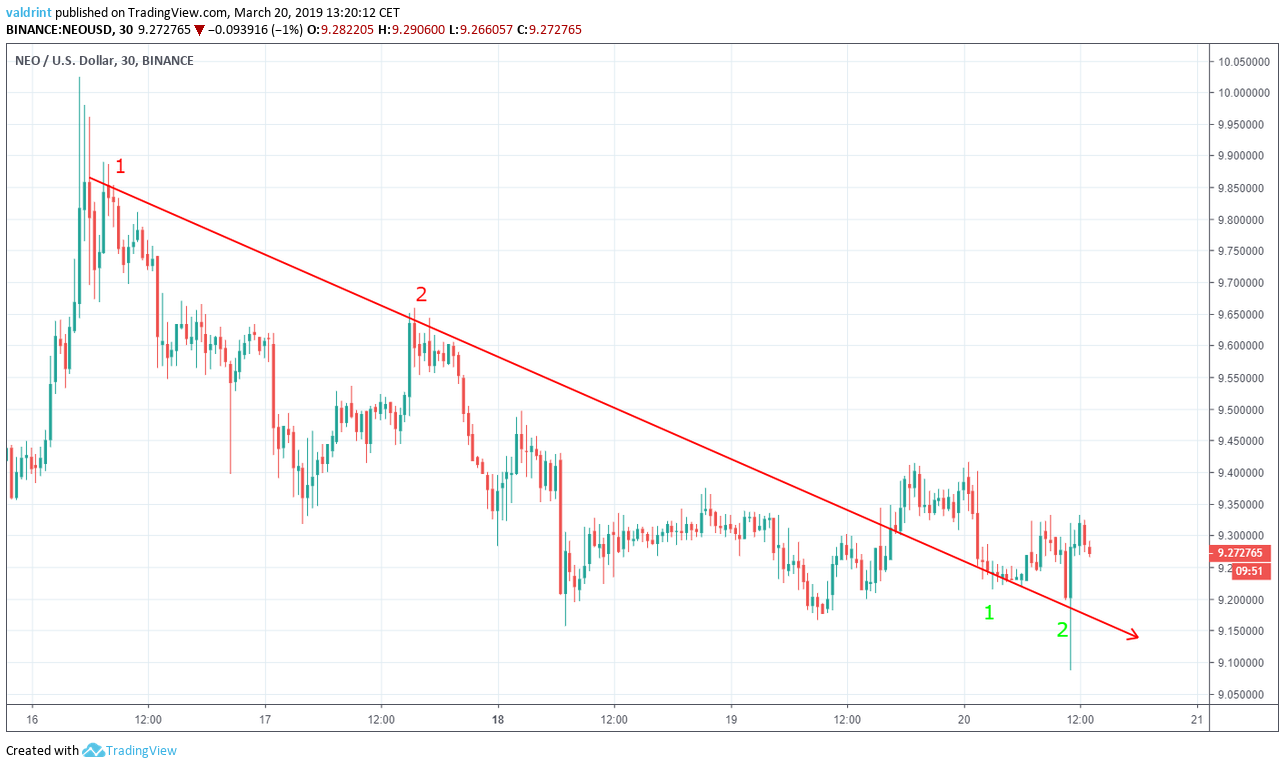
The resistance acts as a ceiling to price, preventing further upward movement and measuring the prices rate of decrease.
Movement above this line is unlikely unless a breakout occurs. NEO experienced a breakout on Mar 19. After the breakout, the price dropped to touch the resistance line, validating it as a potential support line for the future.
More touches are required for the line to be considered as a definite support line.
Based on this resistance line, it is likely that the price keeps increasing past the resistance. As this occurs, new resistance is likely to emerge. The current resistance may become support—suggesting continued decreases or the resistance may become an upward trend signifying continued price increases.
Developing Support
On Mar 18, the price made a low of $9.15. A gradual uptrend ensued. The price has made several higher lows since.
Tracing these lows gives us an ascending support line.
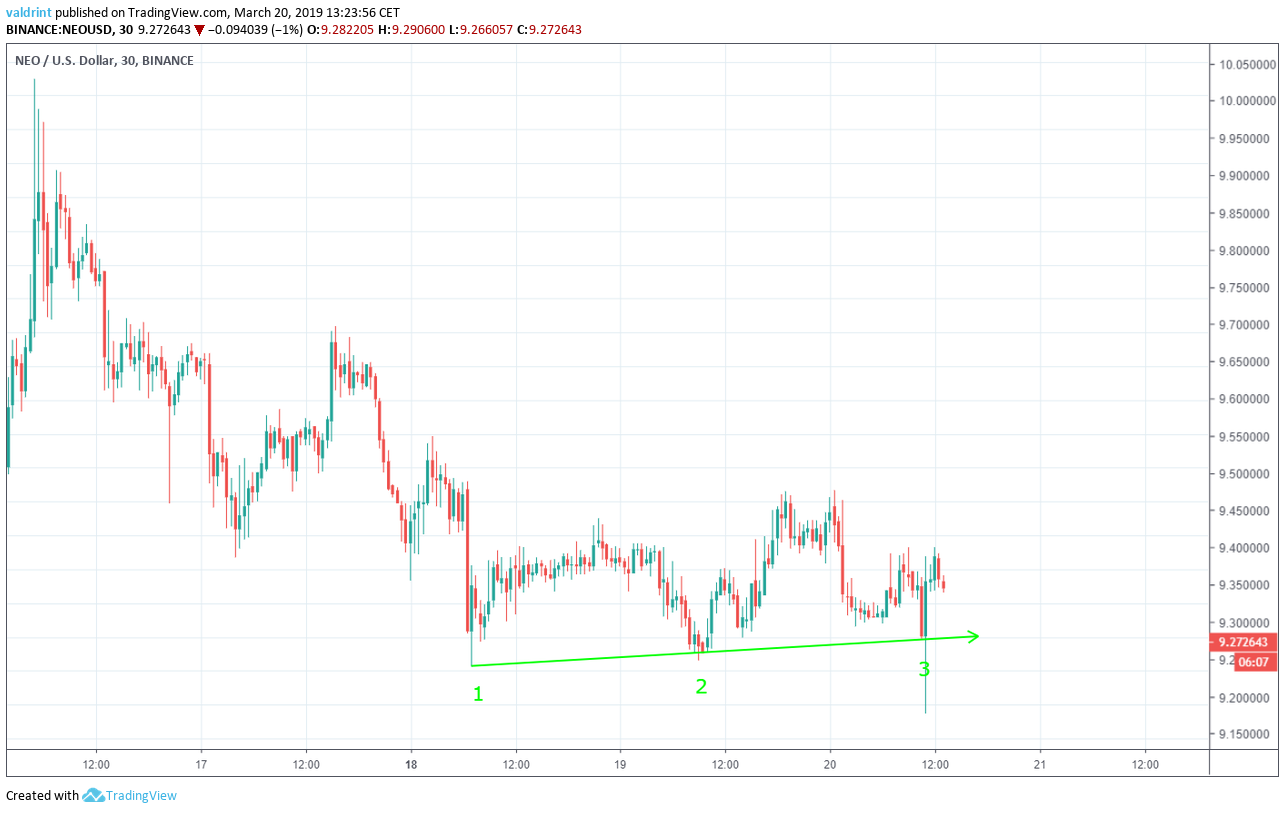 Similar to the resistance line, the support line acts as a floor to price, preventing further downward movement. It also serves to measure the rate of increase of the price.
NEO’s price has increased at the same rate as predicted by the support line. This signifies that the downtrend measured by the resistance may no longer be an accurate gauge of future price.
It also appears that the former resistance has not become a new support line. On the contrary, new support emerged on Mar 18 with three points of validation. The greater the number of points, the more accurate the support line becomes an indicator of future price trends and the average rate of growth for a given period.
Wick breakdowns such as the $9.09 low on Mar 20 can be considered insignificant since the price immediately rebounded to close above the support line.
It is likely that the price keeps increasing at a steady rate predicted by the short-term support line. If this occurs, new points may emerge along the support line. This would increase its validity.
Bullish Divergence
Combining RSI bullish/bearish divergence with support/resistance essentially predicts price fluctuations.
The relative strength index (RSI) is an indicator which calculates the size of the changes in price in order to determine oversold or overbought conditions in the market.
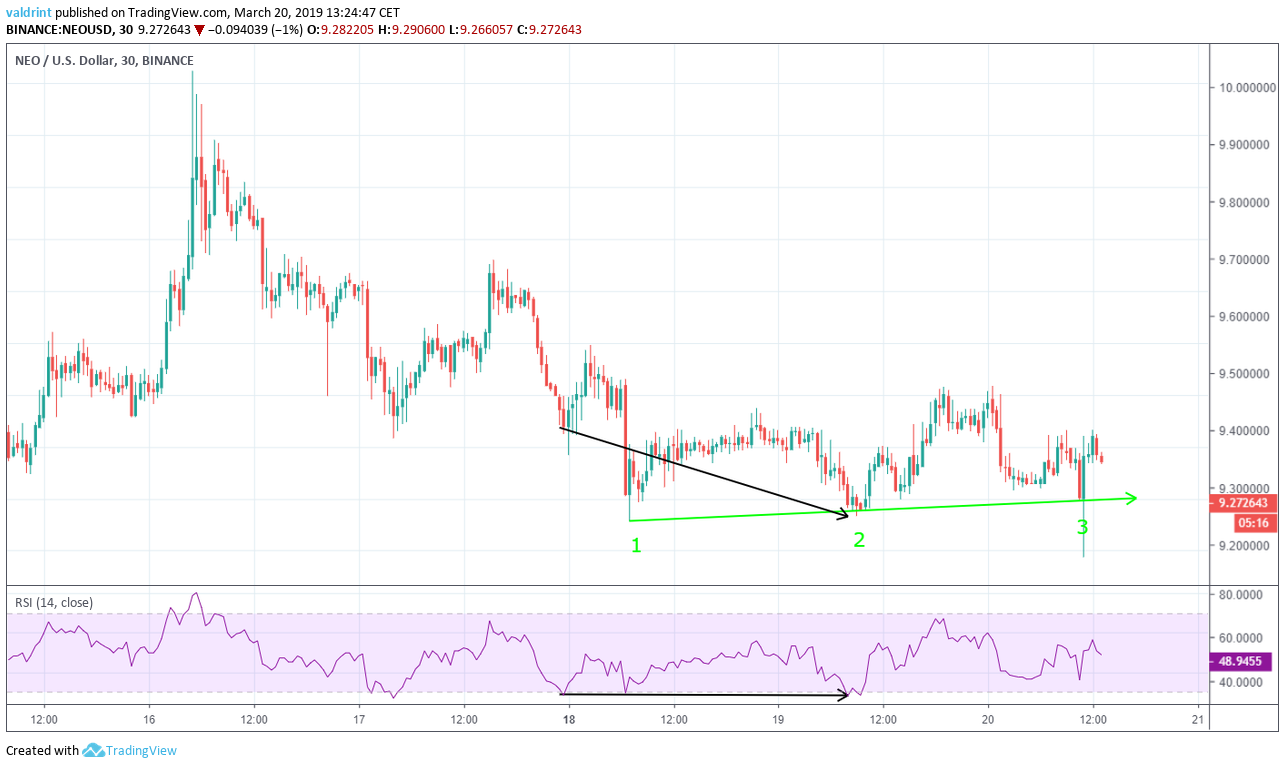
On Mar 17, the price made a low of $9.31. A gradual drop ensued, and the price continued to make a low of $9.17 on Mar 19.
Similarly, the RSI made a low of 28 on Mar 17. However, instead of making another low on Mar 19, it reached the same level. This is known as bullish divergence and often precedes price increases.
This analysis suggests that the upward support may be a likely indicator of future values. It appears as if a reversal from the downward resistance occurred on Mar 18. At the time of writing, it seems that a new upward trending support line has already appeared which may indicate the rate of NEO’s growth for at least the short-term.
Reversal Areas
The price of NEO on Binance is analyzed at two-hour intervals from Feb 22 to Mar 20, in order to better visualize potential reversal areas in the future.
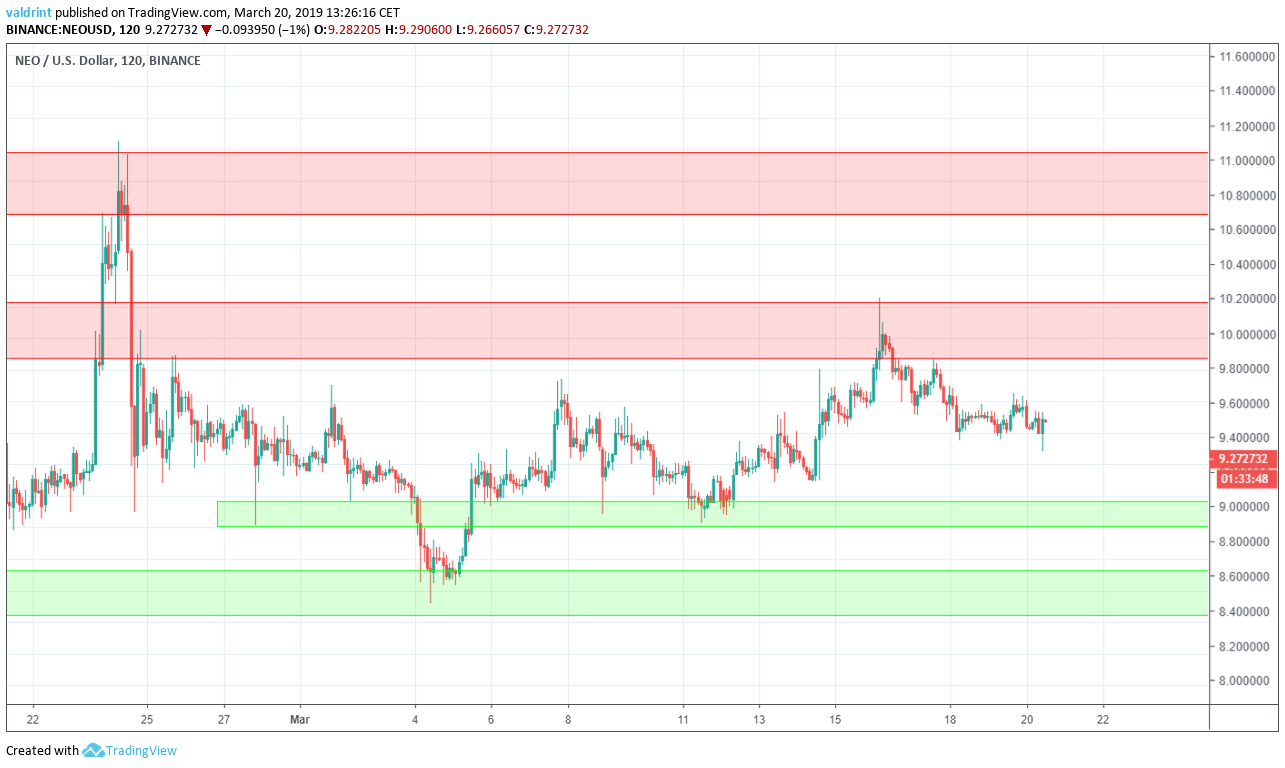
Resistance and support areas are formed when the price reaches a certain level several times. They can act as a ceiling/floor that prevents the price from moving further in that direction.
The first area of resistance is found near $10. If the price keeps increasing at a steady rate, it will eventually reach this level. The next area of resistance is found near $10.8. Based on this analysis, the price may eventually reach at least one of these areas.
The closest support area is found near $9. If the price breaks down from the support, this would present a likely reversal area. If it keeps dropping, the next support area is found near $8.5. Based on this analysis, it is unlikely that the price will reach this level.
Summary of Analysis
Based on this analysis, the price of NEO is likely to keep increasing at a steady rate until it creates new resistance and support levels. If the price eventually reaches the $10 area, this prediction will be validated. A breakdown below $9 would invalidate the prediction.
Do you think the price of NEO will keep increasing at a steady rate? Let us know in the comments below.
Disclaimer: This article is not trading advice and should not be construed as such. Always consult a trained financial professional before investing in cryptocurrencies, as the market is particularly volatile.