T2108 Status: 69.6% (ending a 2-day overbought period)
VIX Status: 13.4
General (Short-term) Trading Call: Short (fade rallies)
Active T2108 periods: Day #188 over 20%, Day #37 over 50%, Day #5 over 60%, Day #1 under 70% (underperiod)
Commentary
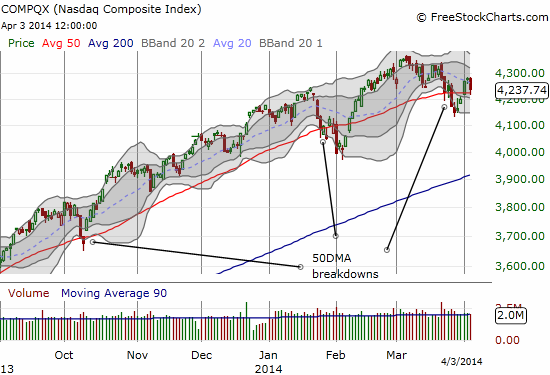
The routine of churning in and out of overbought conditions continues. Since I round T2108 to the nearest decimal (tenth), T2108 has officially dropped from overbought conditions. This move marks the end of the fourth overbought period in five weeks, and fifth overbought period in about 10 weeks. This kind of “indecision” is extremely rare. My decision to simply stick with the bearish bias has only worked as well as it has because 1) I have adjusted (most) trading to very short timeframes, 2) I have only faded rallies, 3) AND the churn in the S&P 500 (SPY) has not allowed it to gain much upward momentum. Regarding the third point, the S&P 500 is “only” up 1.6% in the past five weeks (yes, annualized, that is a very good gain). More importantly, given the high focus on wavering momentum and speculative stocks, the NASDAQ (QQQ) is DOWN 1.6% over that same period of time.
The NASDAQ’s gravitational pull had a notable effect on some notable tech-related stocks. I have cherry-picked three, all related to the internet: Google (GOOG), Facebook (FB), and Amazon.com (AMZN).
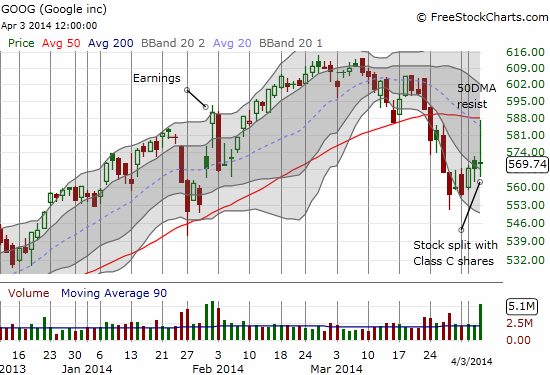
GOOG is the most notable because today the stock effectively split 2:1 (it needed a 10:1 split!) while stripping investors of voting power. Oddly enough, the loss of control motivated massive buying of the stock. Or that is what it seems at the surface.
I am guessing a stock-split trading strategy was really at work. A lower priced stock is supposed to be more attractive to retail investors because they can buy more shares with the same amount of money. The average retail investor probably only wanted to buy 1 or 2 shares of GOOG at its $1100-1200 price, a very unattractive proposition. But GOOG’s 2:1 stock split barely solves the problem of the average retail investor. So, when I saw the stock surge anyway, even with the NASDAQ wavering, I scratched my head. Once I looked at the chart, I immediately shorted the stock. I was already a little late but I plunged in anyway after noticing that GOOG’s surge stopped cold at its 50DMA. This is one of the easiest technical trades a trader can ever hope to find: 1) a fade from critical resistance, 2) a surge that makes no logical sense, and 3) an out-sized move (+3.3% at the highs) against general market momentum.
Sticking to the theme of very short-term trades, I bailed on the position after getting 10 points on the fade. The stock is now in a precarious position but it will take a lower low to raise a bright red bear flag again.
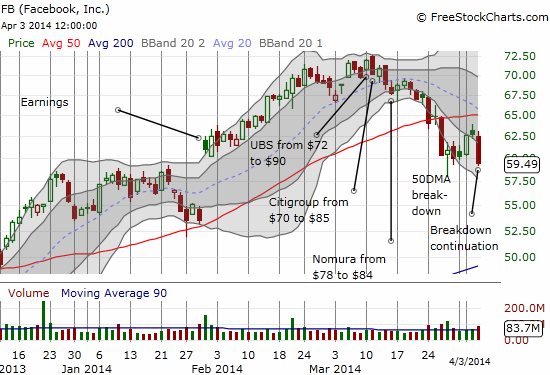
Facebook still looks like it is slowly but surely topping…for a good, long while. Perhaps traders sold Facebook to buy Google. Hard to say. But FB’s 5.2% drop all but confirmed the current downward momentum and the 50DMA as resistance. FB closed at a fresh 2+ month closing low on the way to what must be a fill of the January up gap. Although FB is printing a classic bearish pattern custom-made for shorting, I took this opportunity to further hedge my bets with a May call spread. As a reminder, the strategy for FB for some time now has been to continue accumulating a short position at higher prices and to trade quickly in and out of call options on the way up. Increasingly, it seems the need for hedging is fading along with the stock.
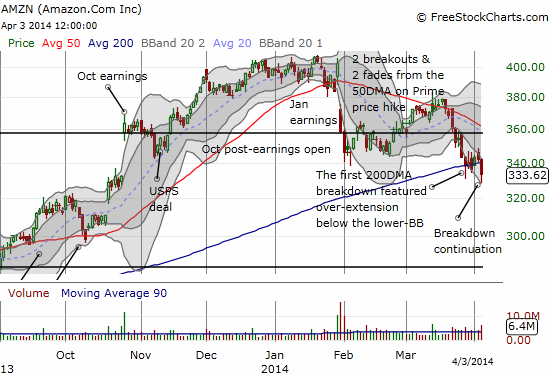
Finally, stubborn Amazon.com (AMZN) is actually breaking down. AMZN has not closed this low since October, 2013. Not only is it confirming resistance at its 200DMA, but also the stock has now filled in its October earnings gap up. I do not remember when AMZN last filled an earnings gap up, but I believe it has been a very long time!
Since all three of these stocks are in the NASDAQ, we should not be surprised to see notable downdrafts. However, they are now very notable as they represent relative weakness (the NASDAQ is still trading above its 50DMA) in an index that is itself weak relative to the general market. I continue to focus my fades on QQQ puts as opposed to SSO puts, and I am back on the prowl for wavering momentum stocks even as other bear-confirming signals have yet to materialize.
Daily T2108 vs the S&P 500
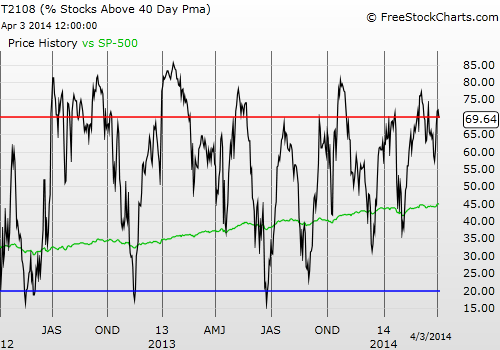
Black line: T2108 (measured on the right); Green line: S&P 500 (for comparative purposes)
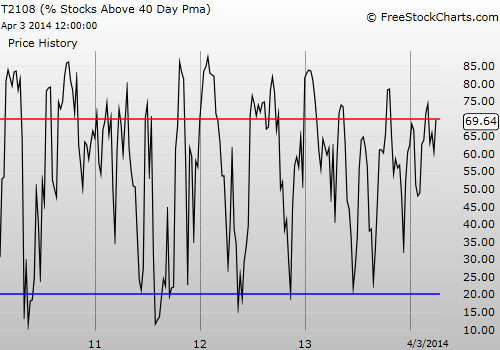
Red line: T2108 Overbought (70%); Blue line: T2108 Oversold (20%)
Weekly T2108
Full disclosure: long SSO puts, long QQQ puts, short FB and long call options and spreads
Which stock should you buy in your very next trade?
With valuations skyrocketing in 2024, many investors are uneasy putting more money into stocks. Unsure where to invest next? Get access to our proven portfolios and discover high-potential opportunities.
In 2024 alone, ProPicks AI identified 2 stocks that surged over 150%, 4 additional stocks that leaped over 30%, and 3 more that climbed over 25%. That's an impressive track record.
With portfolios tailored for Dow stocks, S&P stocks, Tech stocks, and Mid Cap stocks, you can explore various wealth-building strategies.

