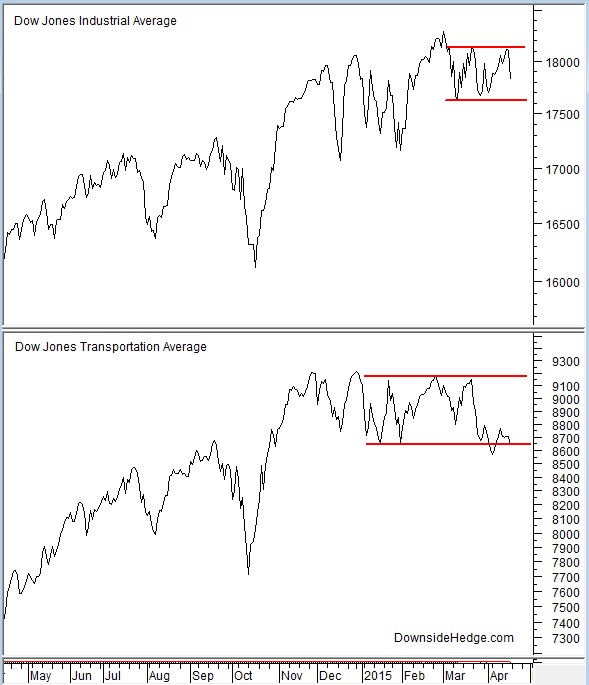
Earlier in the month I highlighted some technical analysis indicators that showed a battle between accumulation and distribution. As of Friday we have more evidence of a battle between people accumulating stock and distributing it. This evidence comes from Dow Theory. Friday’s decline in the Dow Jones Industrial Average (DJIA) created a Dow Theory line. Both averages are now showing a pattern that indicates either accumulation or distribution is underway, but we’ll have to wait and see how these patterns resolve to know which will win.
William Peter Hamilton stated:
When a ‘line’ is in process it is the hardest thing in the world to tell either the nature of the selling or that of the buying. Both accumulation and distribution are at work, and no one can say which will ultimately exercise the greatest pressure.
When the pattern is broken we’ll have an answer that will have a significant impact on the market. Hamilton said that the break of a line will indicate a change in general market direction of at least secondary importance and occasionally a primary trend change. Since Dow Theory currently has the market in a primary bull trend, a break of both averages below their lines would result in a decline that creates a new secondary low point. It would also serve as warning that the primary trend may have changed from bullish to bearish. A break to new highs would reconfirm the long term bull market and suggest that it has much further to go.

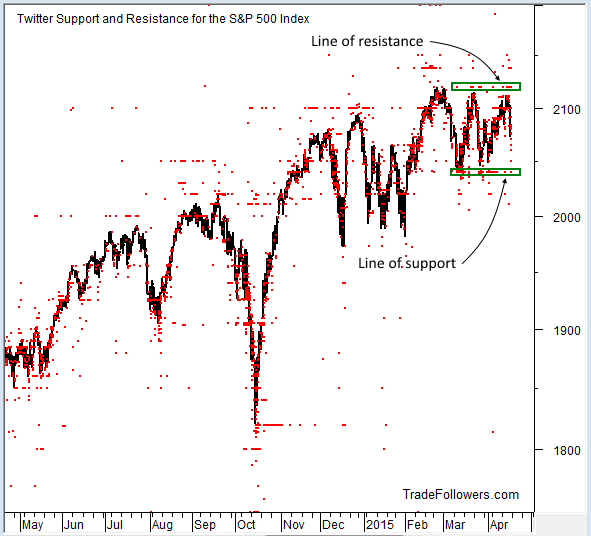
I’m also seeing a ‘line’ of sorts in price projections coming from the Twitter) stream. While Dow Theory uses price to create the line, Twitter (NYSE:TWTR) support and resistance levels create a line based on expectations tweeted by traders and investors. As a result, they represent strong psychological barriers. If they are broken, either up or down, they cause a capitulation in sentiment from those who were trading or accumulating/distributing against the line of support or resistance. The current level of support is 2040 on the S&P 500 Index (SPX). Resistance is at 2120.

Bottom line, a battle between accumulation and distribution is under way. Fortunately, all we have to do is watch for a break of the range to know the next intermediate term direction.
Which stock should you buy in your very next trade?
AI computing powers are changing the stock market. Investing.com's ProPicks AI includes 6 winning stock portfolios chosen by our advanced AI. In 2024 alone, ProPicks AI identified 2 stocks that surged over 150%, 4 additional stocks that leaped over 30%, and 3 more that climbed over 25%. Which stock will be the next to soar?
Unlock ProPicks AI