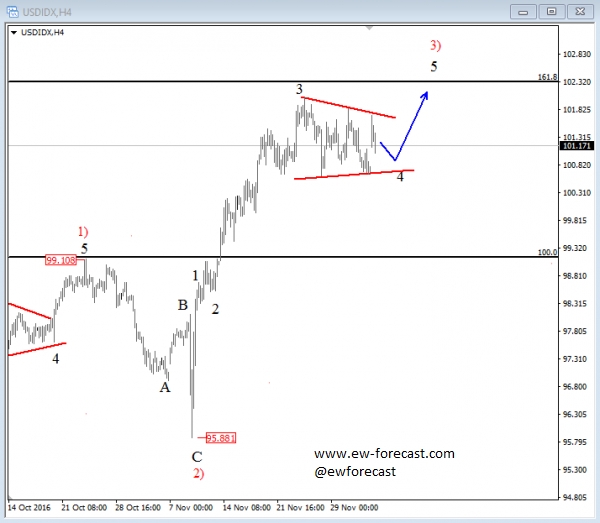
USD index is in a strong uptrend since the US elections, a clear impulsive structure on the 4h chart that belongs to a bigger wave five visible on higher time frames.
As such, we see index headed up to 103-105 area in the next few weeks after any corrective move. At the moment, we see slow price action above 100.60; so it's wave four that we are tracking as a possible triangle correction that is pointing higher into wave five.
USD Index, 4h
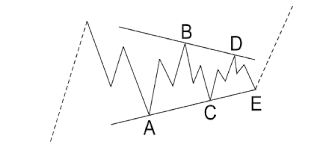
A Triangle is a common 5 wave pattern labeled A-B-C-D-E that moves counter-trend and is corrective in nature. Triangles move within two channel lines drawn from waves A to C, and from waves B to D. A Triangle is either contracting or expanding depending on whether the channel lines are converging or expanding. Triangles are overlapping five wave affairs that subdivide 3-3-3-3-3.
Basic Triangle Pattern:
Which stock should you buy in your very next trade?
With valuations skyrocketing in 2024, many investors are uneasy putting more money into stocks. Unsure where to invest next? Get access to our proven portfolios and discover high-potential opportunities.
In 2024 alone, ProPicks AI identified 2 stocks that surged over 150%, 4 additional stocks that leaped over 30%, and 3 more that climbed over 25%. That's an impressive track record.
With portfolios tailored for Dow stocks, S&P stocks, Tech stocks, and Mid Cap stocks, you can explore various wealth-building strategies.


