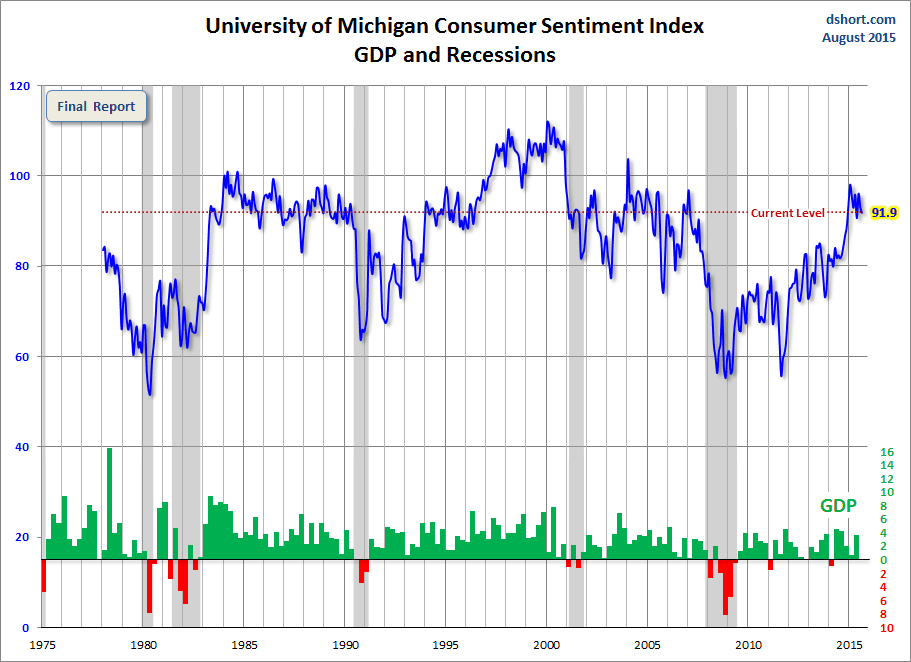
The University of Michigan Final Consumer Sentiment for August came in at 91.9, a slight decrease from the 92.0 Preliminary reading. Investing.com had forecast 93.0 for the August Final.
Surveys of Consumers chief economist, Richard Curtin makes the following comments:
How will consumers react to volatile stock prices? The Black Mondays of October 17, 1987 and August 24, 2015 represent two episodes when the stock market declined mainly due to reasons other than the domestic economy. Prior to each stock decline, the Sentiment Index was very positive, but immediately following, it fell by about 10%. Consumers quickly dismissed the 1987 episode since it didn't involve their jobs or incomes, and today's consumers hold similar favorable views about their job and income prospects. While this preliminary reading must be confirmed by additional data, there is every reason to expect continued growth. Overall, the data suggest that real personal consumption expenditures will expand by a still healthy 2.9% in 2015, with the pace of growth rising to 3.0% in 2016. Needless to say, consumer sentiment must be carefully monitored in the months ahead. [More...]
See the chart below for a long-term perspective on this widely watched indicator. Recessions and real GDP are included to help us evaluate the correlation between the Michigan Consumer Sentiment Index and the broader economy.

To put Friday's report into the larger historical context since its beginning in 1978, consumer sentiment is now 8 percent above the average reading (arithmetic mean) and 9 percent above the geometric mean. The current index level is at the 64th percentile of the 452 monthly data points in this series.
The Michigan average since its inception is 85.3. During non-recessionary years the average is 87.5. The average during the five recessions is 69.3. So the latest sentiment number puts us 22.6 points above the average recession mindset and 4.4 points above the non-recession average.
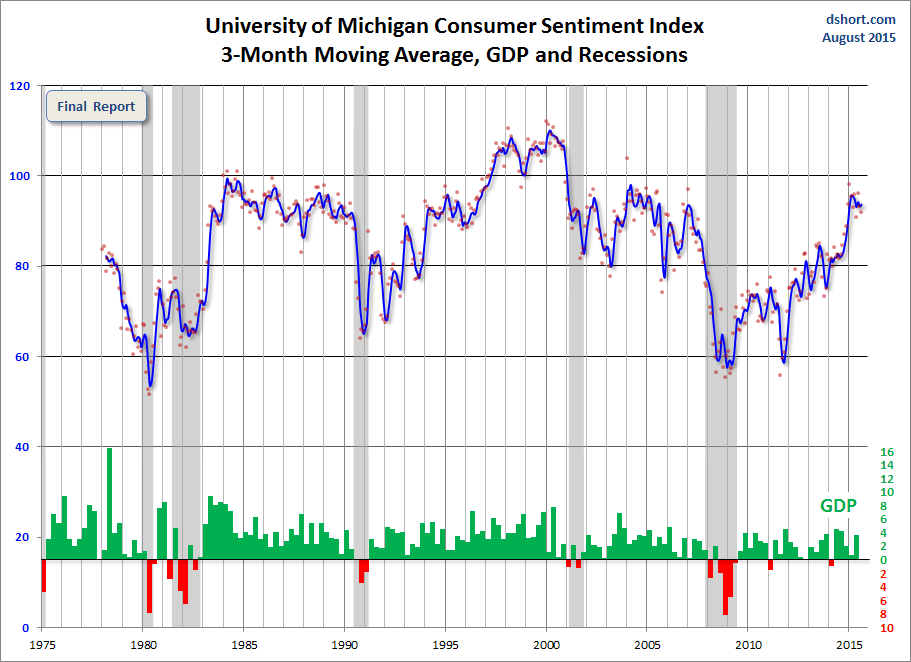
Note that this indicator is somewhat volatile, with a 3.1 point absolute average monthly change. The latest data point was a 1.2 point change from the previous month. For a visual sense of the volatility, here is a chart with the monthly data and a three-month moving average.

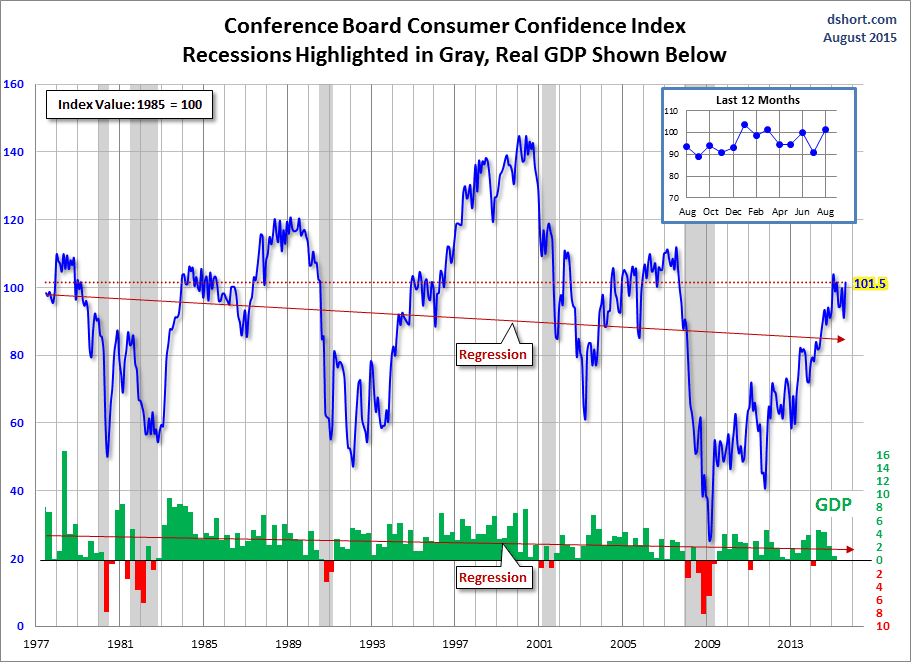
For the sake of comparison, here is a chart of the Conference Board's Consumer Confidence Index (monthly update here). The Conference Board Index is the more volatile of the two, but the broad pattern and general trends have been remarkably similar to the Michigan Index.

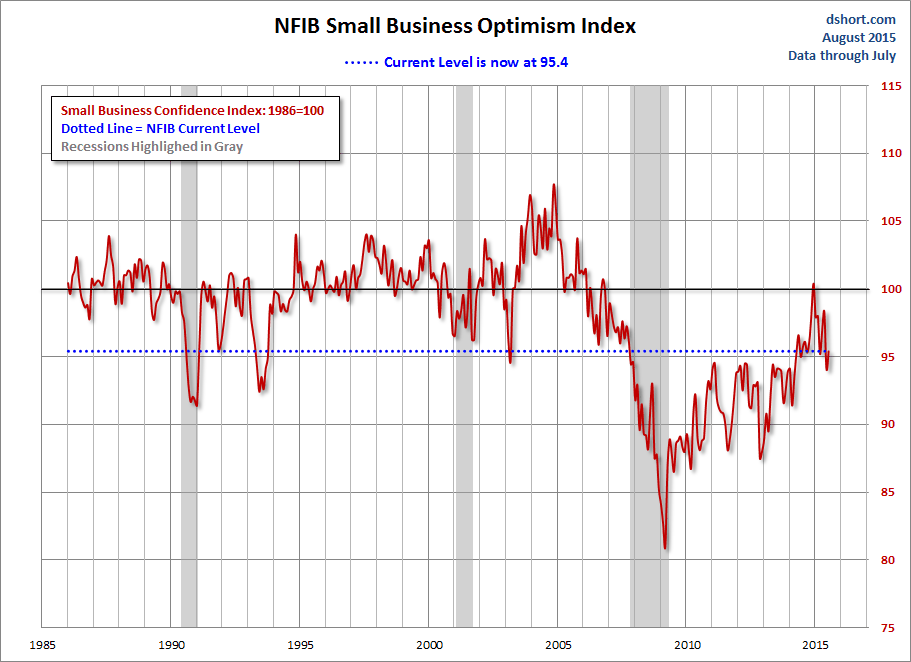
And finally, the prevailing mood of the Michigan survey is also similar to the mood of small business owners, as captured by the NFIB Business Optimism Index.

The general trend in the Michigan Sentiment Index since the Financial Crisis lows has been one of slow improvement. But the survey findings since December have been relatively range bound with January remaining the interim peak.
Which stock should you buy in your very next trade?
AI computing powers are changing the stock market. Investing.com's ProPicks AI includes 6 winning stock portfolios chosen by our advanced AI. In 2024 alone, ProPicks AI identified 2 stocks that surged over 150%, 4 additional stocks that leaped over 30%, and 3 more that climbed over 25%. Which stock will be the next to soar?
Unlock ProPicks AI