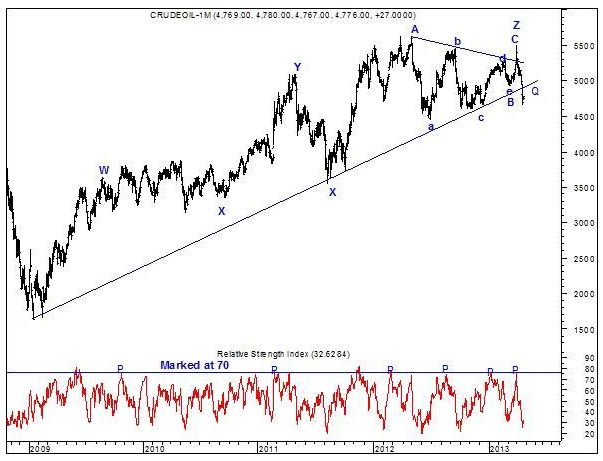
In the months of 2009, prices made a low of 1625 and completed impulsive move on downside. Thereafter, prices moved higher in a corrective manner consecutively for three years (2009-2012) and made a high of 5520. In the last week, MCX Crude breached the multiyear upward sloping trend line on downside and moved lower along with bullions.

The Commodity Waves in the chart is where we can see a clear breakout and signal of end of multiyear up move.
MCX Crude daily chart: The chart clearly shows the fall of 2008 in MCX Crude which took approximately 8 months from 6300 to 1650. It has been more than 4 years and prices have not been able to capture the previous territory. Also a clear break of multiyear trend line since 2009 clearly indicates the major trend which is down is probably resuming.
However, trading cannot be done based on only a major trend but to position oneself correctly it is imperative to know the short term trend as well. The daily commodity research report shows not only the bigger trend but also the short term direction with crucial support and resistance levels.
3rd party Ad. Not an offer or recommendation by Investing.com. See disclosure here or remove ads.
Which stock should you buy in your very next trade?
AI computing powers are changing the stock market. Investing.com's ProPicks AI includes 6 winning stock portfolios chosen by our advanced AI. In 2024 alone, ProPicks AI identified 2 stocks that surged over 150%, 4 additional stocks that leaped over 30%, and 3 more that climbed over 25%. Which stock will be the next to soar?
Unlock ProPicks AI