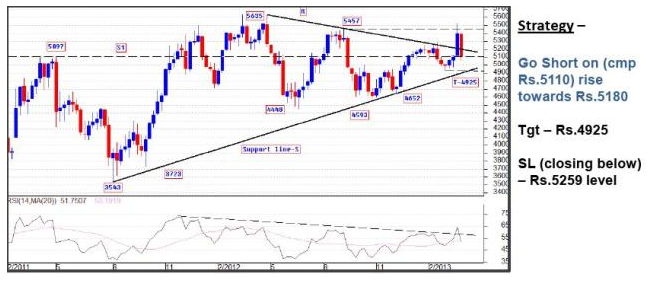
As shown in the chart, MCX Crude price has given upside breakout of Symmetrical triangle pattern on weekly charts. Price breached the previous of Rs 5457 and made a high of Rs 5517, but was unable to sustain, giving a sharp decline last week and closing below the short term trend line R.
Also, the 14-period RSI is currently holding below the horizontal line, trading below the sloping trend line indicates bearish momentum for the short-term.
3rd party Ad. Not an offer or recommendation by Investing.com. See disclosure here or remove ads.
Which stock should you buy in your very next trade?
With valuations skyrocketing in 2024, many investors are uneasy putting more money into stocks. Unsure where to invest next? Get access to our proven portfolios and discover high-potential opportunities.
In 2024 alone, ProPicks AI identified 2 stocks that surged over 150%, 4 additional stocks that leaped over 30%, and 3 more that climbed over 25%. That's an impressive track record.
With portfolios tailored for Dow stocks, S&P stocks, Tech stocks, and Mid Cap stocks, you can explore various wealth-building strategies.
