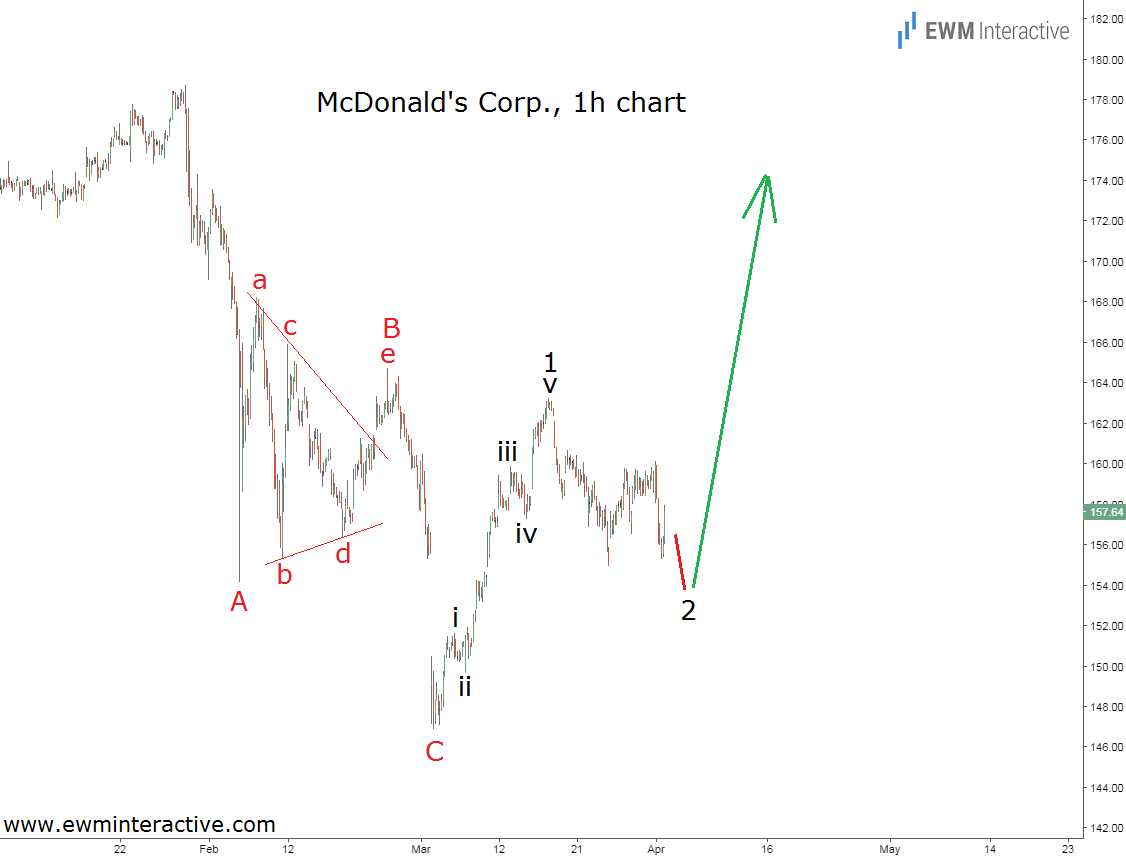
Despite declining revenues in the last several years, McDonald’s Corporation (NYSE:MCD)’ profits are still on the rise. The company’s stock was also climbing until late-January 2018, when it reached an all-time high of $178.68. But instead of going for the $180 mark, the bulls could not maintain the positive momentum. A little over a month later, MCD was down to $146.85 a share on March 2nd. After a swift rally to $163.22, McDonalds stock is currently hovering around $157. In order to extract the meaning of all these seemingly random figures, we need to put our Elliott Wave glasses on and see if a recognizable pattern would emerge.
The hourly chart of McDonalds stock shows that the February decline was a simple A-B-C zig-zag correction with a triangle in the position of wave B. Note that wave “e” of B breaches the upper line of the pattern by a large margin, but does not exceed the high of wave “c”. Triangles precede the final wave of the larger sequence. Here, the final wave is C, which terminated at $146.85, thus completing the entire corrective decline.
The structure of the following recovery is confirming the positive outlook. It comes in the form of a five-wave impulse, labeled i-ii-iii-iv-v in wave 1. The recent pullback from $163.22 should be wave 2, which suggests McDonalds stock is now ready to conquer $180 in wave 3. The bulls should not give up as long as the share price stays above the starting point of the impulse pattern.
Which stock should you buy in your very next trade?
AI computing powers are changing the stock market. Investing.com's ProPicks AI includes 6 winning stock portfolios chosen by our advanced AI. In 2024 alone, ProPicks AI identified 2 stocks that surged over 150%, 4 additional stocks that leaped over 30%, and 3 more that climbed over 25%. Which stock will be the next to soar?
Unlock ProPicks AI