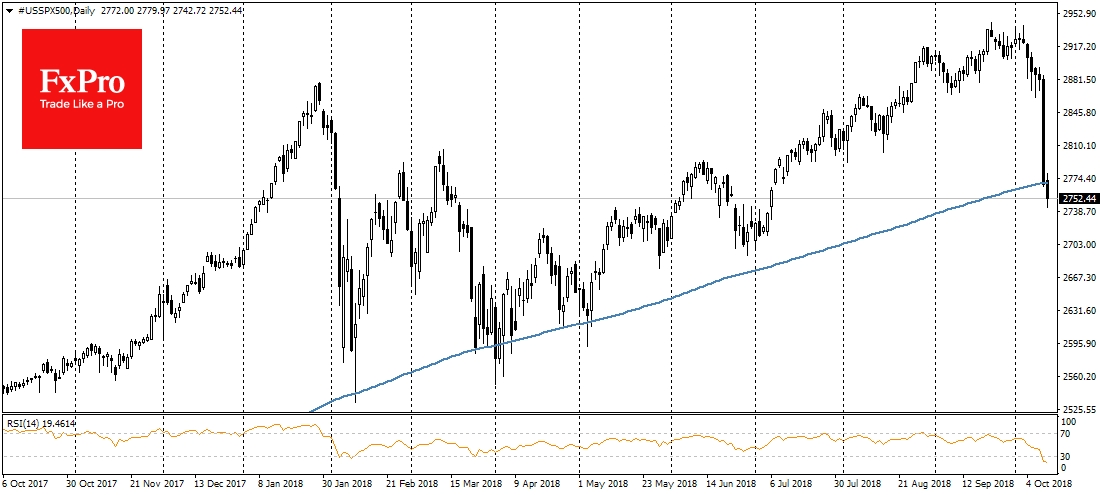
Yesterday, the U.S. stock markets were covered by the strongest sale-off since February. Previously, we pointed to the disturbing signs in the dynamics of the American markets: the beginning of the American sessions for last week was marked by a sharp decline, and the debt markets continued to pressure, causing a rise in the yield of the U.S. government bonds. The trigger for the sale were the the head of the IMF’s words, who called the current stocks valuations “extremely high”.
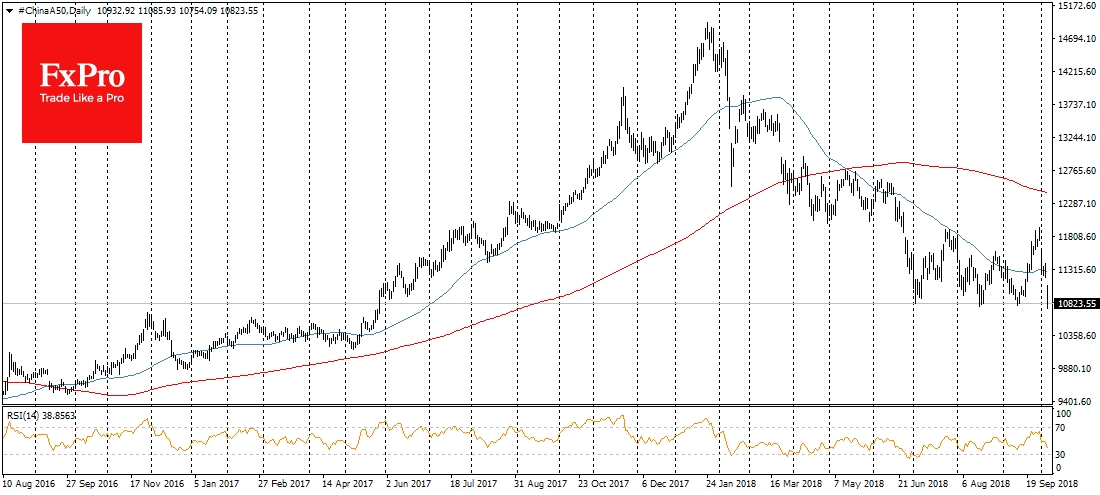
The futures on S&P 500 sank in the previous day by 4.3%, falling to the lows since July. A flight from the risks spread over the Asian markets on Thursday morning: MSCI Asia ex Japan loses 3.7%, sinking to the lows from March 2017, Chinese largest companies, China A50 Blue chip index loses 4%.
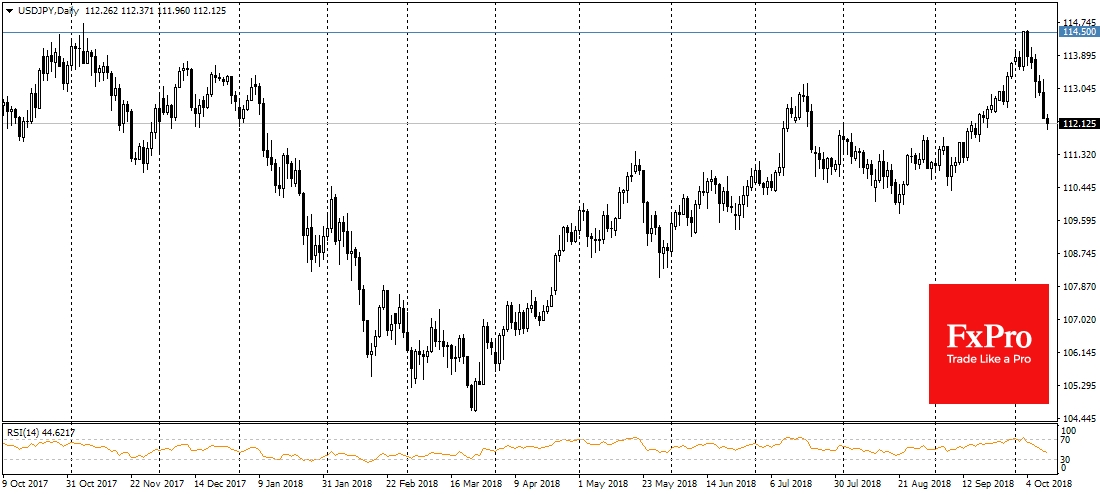
Together with the stock markets, there is a pressure on the pair of USD/JPY, which lost 2.2% per week and has fallen below 112 in the morning. The Chinese yuan also shows the warning signs. USD/CNH is traded near 6.94 – one step from peak levels since January 2017. The futures on the American indices remain under pressure from Thursday morning.
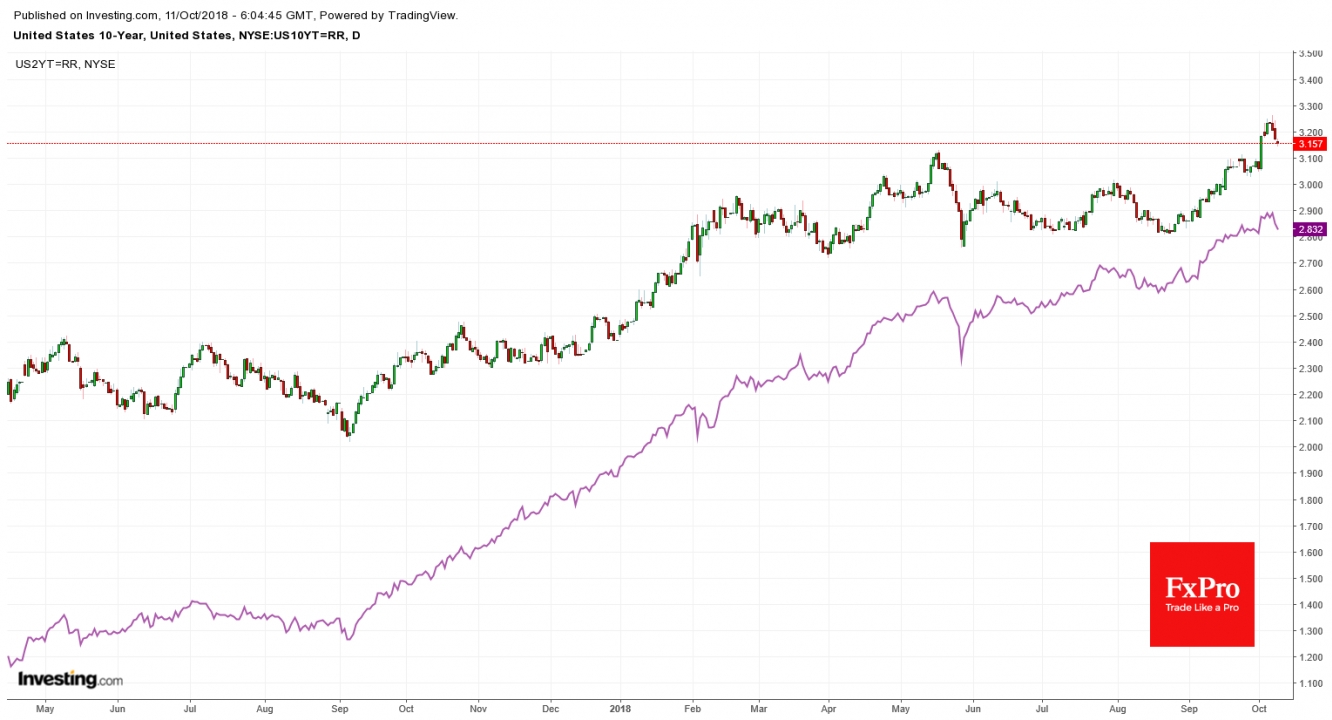
But it is worth mentioning a couple of positive points. The U.S. government bond yields have moved away from multi-year peaks, which can reduce the pressure on the stocks later in the day. It is also noteworthy that we do not see the strengthening of the dollar to most currencies. The dollar index has been decreasing for the 3rd day, descending under 95.0. The currencies of developing countries move with a very measured pace, avoiding abrupt jumps, as it was in August-September. All this can be a sign of a short-term correction, which will not grow into a full sale.
The technical analysis also draws our attention to the fact that the relative strength index for S&P 500 daily chart is below 20, at the lowest level in more than three years. Such low values of RSI indicate the high chances of market rebound in a short term when the sales intensity decreases.
In favour of the rebound there is also the fact that yesterday’s sale was not related so much to the deterioration of the economic data, but to the hawk rhetoric of the Fed and assessments of the situation on the part of the IMF.
Which stock should you buy in your very next trade?
AI computing powers are changing the stock market. Investing.com's ProPicks AI includes 6 winning stock portfolios chosen by our advanced AI. In 2024 alone, ProPicks AI identified 2 stocks that surged over 150%, 4 additional stocks that leaped over 30%, and 3 more that climbed over 25%. Which stock will be the next to soar?
Unlock ProPicks AI


