What’s The ISM?
The US market suffered a bout of confusion yesterday as the ISM manufacturing index was initially announced at 53.2, a decline from the previous month’s 54.9 and far below the expected 55.5. The ISM then corrected the figure to a surprisingly robust 56.0 but later said it was actually 55.4, in line with expectations. The problem was apparently that they used the wrong month’s seasonal adjustment factors. It’s nice to know other people make those kinds of mistakes, too.
Overall, the global manufacturing PMIs released yesterday were not particularly encouraging. Taking 24 of the more important countries, only nine reported an improvement while 15, or two-thirds, showed a decline and several countries – including France, South Korea and Norway – moved from expansion (above 50) to contraction (below 50). This suggests that the recent upswing in the global manufacturing cycle may be drawing to a close. On the other hand, there were only seven countries in contractionary territory, so apparently the upswing hasn’t stopped yet.
Nonetheless it remains to be seen whether the expansion can continue. The rise in Saturday’s official Chinese PMI for May was encouraging, in that it suggests the measures the Chinese government has taken to support growth may be having an impact, but this was somewhat countered by this morning’s downward revision to the May HSBC/Markit manufacturing PMI for China, which remains below 50. If the recovery in China turns out to be a false dawn – for example, if the slowdown in the Chinese real estate market swamps the government’s efforts to boost growth – then I would worry about sentiment towards EM in general and how EM carry trades might perform. The famous “fragile five” – Brazil, Turkey, South Africa, India and Indonesia – would probably come to the fore once again as a slowdown in global activity would make investors more selective and more cautious about selecting carry currencies simply on the basis of yield. Indeed, this concern may explain why the dollar rose against almost all the EM currencies that we track, with four of the aforementioned five currencies doing particularly poorly (INR being the exception as investors await today’s RBI rate decision).
With the US PMI rising to one of the highest in the world (below only UK and Czech Republic), sentiment towards the US economy improved and the implied interest rate on the long-dated Fed Funds futures rose as much as 10 bps yesterday. Implied rates on the Fed Funds futures fell as much as 37 bps following the disappointing Q1 GDP figures, but just in the last few days they have recovered 14 bps or one-third of the decline. That may go a good way towards explaining the recent strength of the dollar, especially in light of questions about other countries’ commitment to raising rates. In addition to the ECB, which is expected to cut rates this week, it’s possible that the Reserve Bank of New Zealand may back off from its hawkish rhetoric at next week’s meeting. This divergence in monetary policy is one reason why I am expecting the dollar (and the pound) to rally broadly over the next several months.
The Reserve Bank of Australia (RBA) held its monetary policy meeting overnight and left rates unchanged, as expected. The RBA once again said that it expected “a period of stability in interest rates.” The tone of the statement was somewhat more optimistic about the domestic economy, which may be why AUD recovered somewhat following the announcement. On the other hand, it repeated its comment about the exchange rate being “high by historical standards” and added “particularly given the further decline in commodity prices.” I agree. This decline in commodity prices and the further decline in the country’s terms of trade implied by the slowdown in the Chinese economy is one of the major reasons why I expect the AUD to weaken going forward.
During the European day, the main event will be Eurozone’s preliminary CPI for May. The bloc’s headline CPI is forecast to have slowed to +0.6% yoy from +0.7% yoy, while the core CPI rate is expected to have declined to +0.8% yoy from +1.0% yoy. Yesterday’s lower-than-expected German CPI has made a slowdown in Eurozone inflation all the more likely. Yet yesterday’s German figure had only a fleeting impact on EUR, which suggests that the ECB’s response is already factored into the price, thus I do not expect much of a reaction to the Eurozone CPI data today. Also today, Eurozone’s unemployment rate for April is expected to have remained unchanged at 11.8%.
In the UK, the Nationwide house price index rose +0.7% mom in May, a slowdown from +1.2% mom the previous month but better than the market forecast of +0.6%. On the other hand, the UK construction PMI for May is forecast to have risen slightly to 61.0 from 60.8.
In the US, factory orders are forecast to have risen 0.5% mom in April, a slowdown from a revised +0.9% mom in March.
We have only one speaker scheduled on Tuesday. Kansas City Fed President Charles Evans will speak on the economy and monetary policy.
The Market
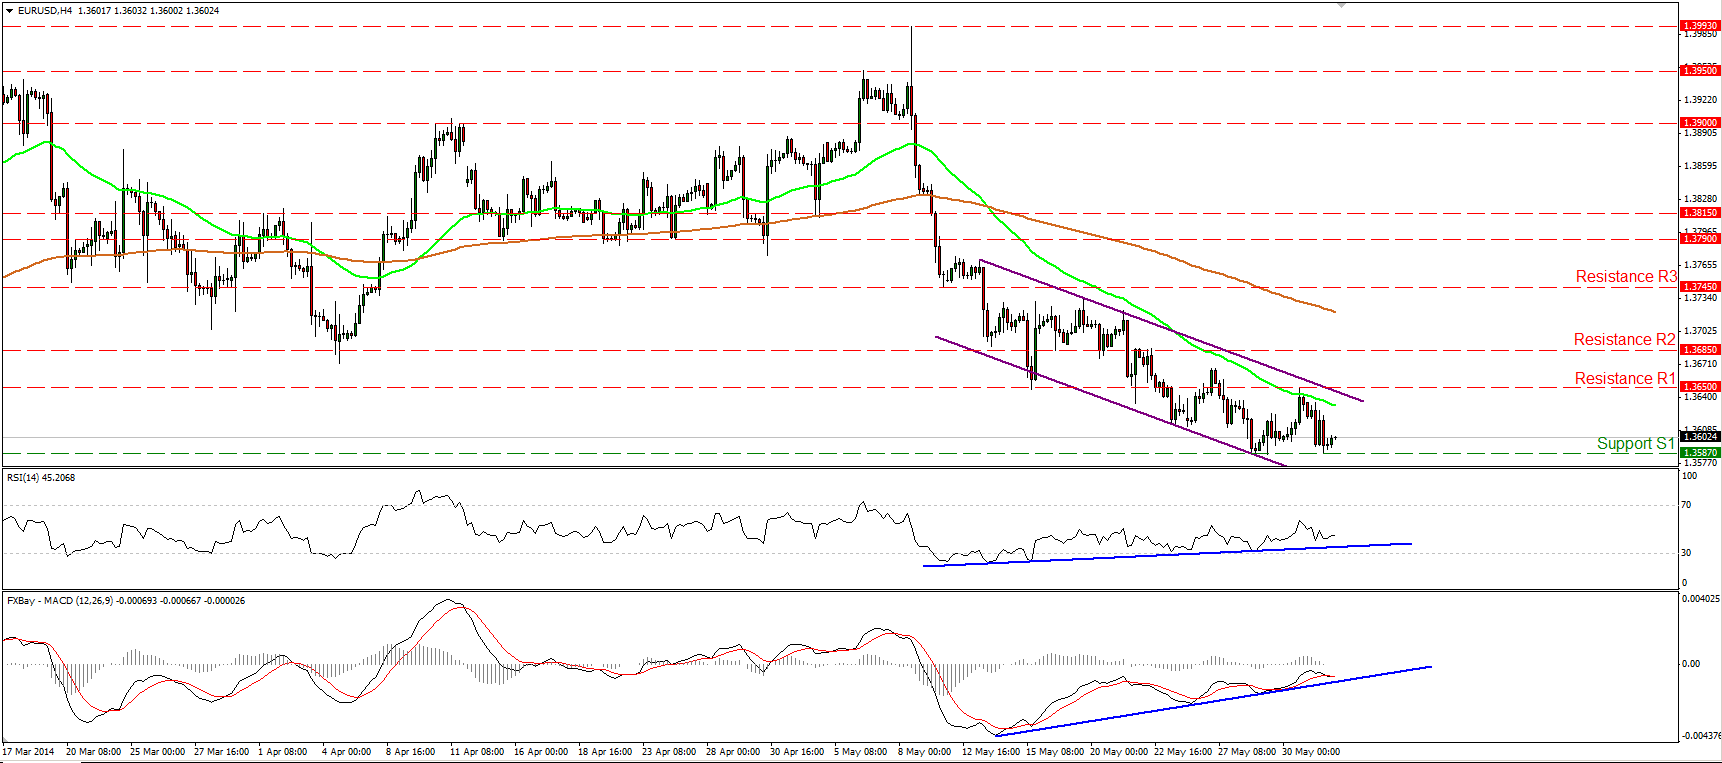
EUR/USD finds support at 1.3587 again
The EUR/USD declined after finding resistance at 1.3650 (R1), near the 50-period moving average, but the decline was halted by the support bar of 1.3587 (S1). As long as the rate is printing lower highs and lower lows within the channel and below both the moving averages, the outlook remains to the downside. A dip below 1.3587 (S1) could signal the continuation of the downtrend and have larger bearish implications, targeting the lows of February at 1.3475 (S2). Nonetheless, the positive divergence between our momentum studies and the price action remains in effect, indicating that the downside momentum is decelerating.
• Support: 1.3587 (S1), 1.3475 (S2), 1.3400 (S3).
• Resistance: 1.3650 (R1), 1.3685 (R2), 1.3745 (R3).
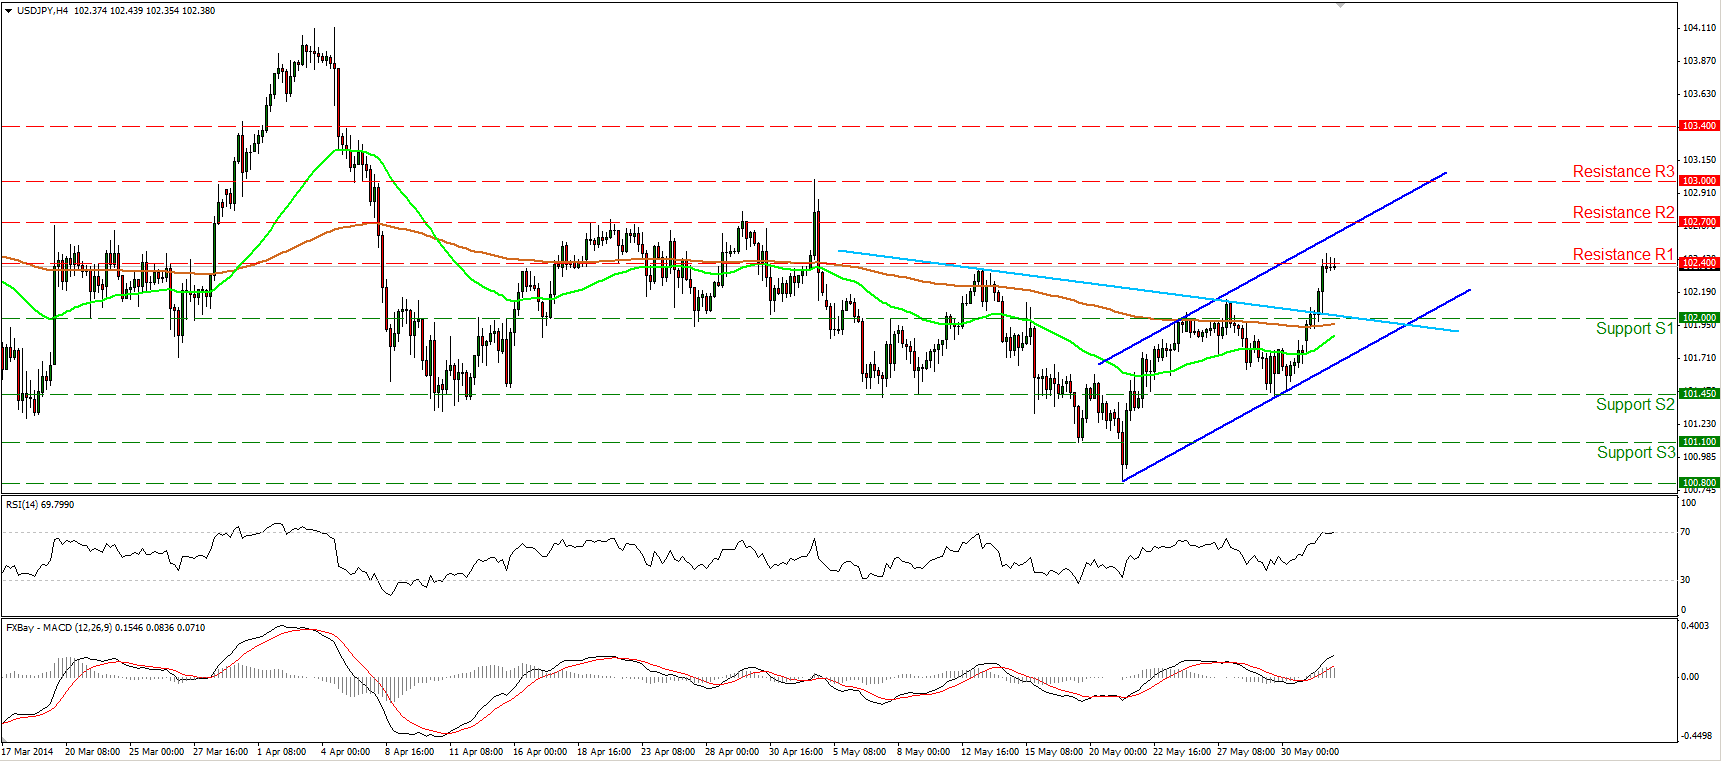
USD/JPY breaks above 102.00
The USD/JPY rebounded from the support bar of 101.45 (S2) and surged to violate the 102.00 hurdle and the 200-period moving average. The violation of the 102.00 area also signaled the completion of a possible inverted head and shoulders pattern. However, the advance was halted at 102.40 (R1) and considering that the RSI found resistance at its 70 level, I cannot rule out a forthcoming bearish wave, maybe to test the neckline (light blue line) and the 102.00 (S1) zone as a support this time. The pair started a structure of higher highs and higher lows and as a result I would consider any declines within the channel as corrective waves.
• Support: 102.00 (S1), 101.45 (S2), 101.10 (S3).
• Resistance: 102.40 (R1), 102.70 (R2), 103.00 (R3).
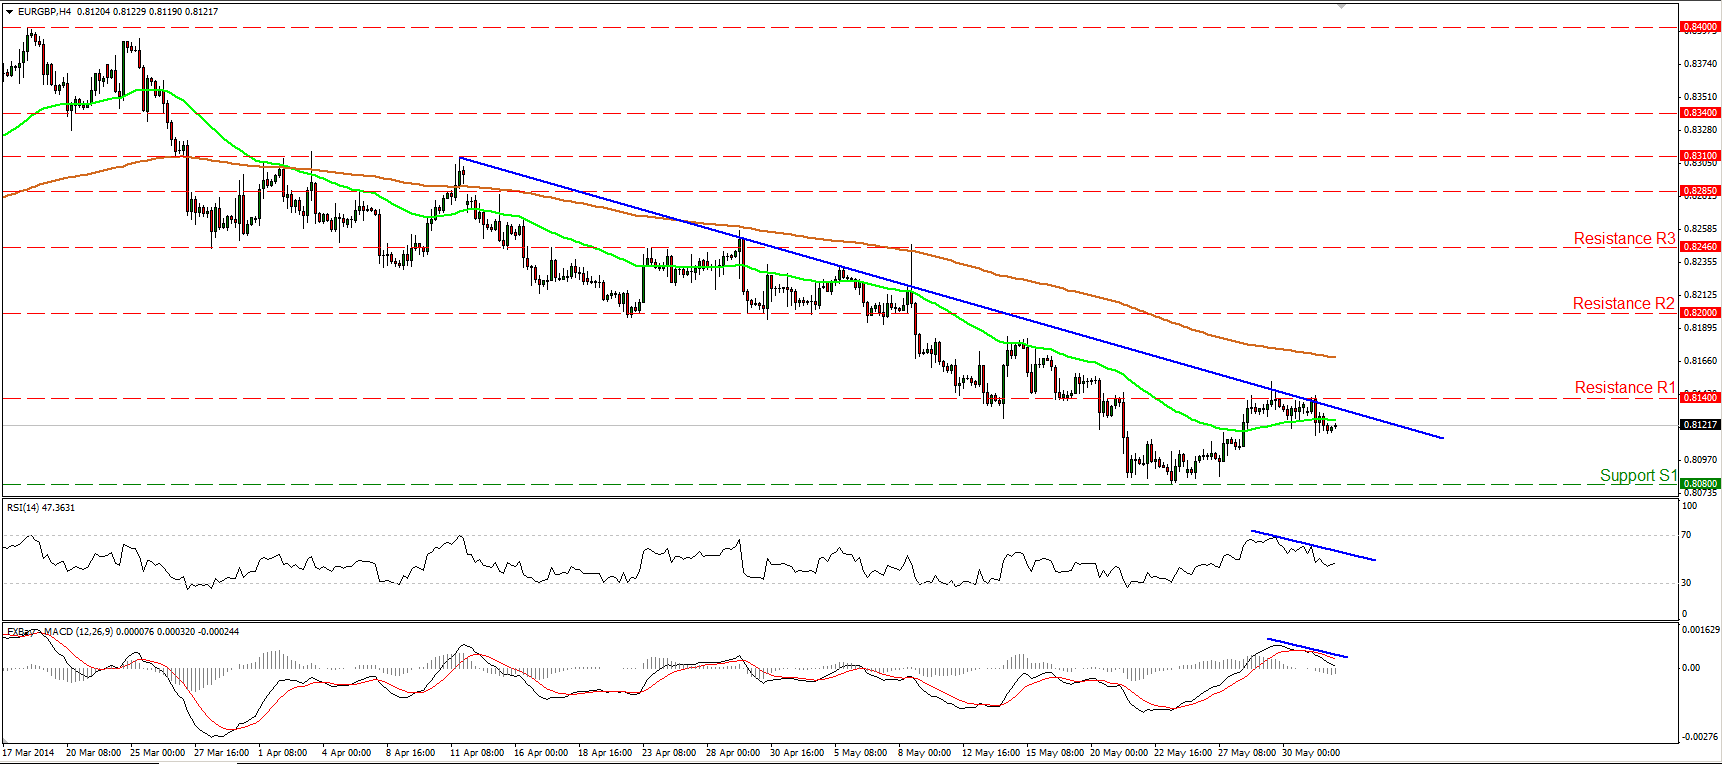
EUR/GBP consolidates below the downtrend line
The EUR/GBP moved in a consolidative mode, remaining below the blue short-term downtrend line. Although the downtrend remains intact, only a dip below the 0.8080 (S1) support could trigger its continuation and signal a forthcoming lower low. Both our momentum studies follow downward paths while the MACD, already below its trigger line, seems ready to enter its negative territory. As a result another decline towards the lows of 0.8080 (S1) is possible in the near future. Only a move above the downtrend line and the resistance of 0.8140 (R1) could be a reason to reconsider our analysis.
• Support: 0.8080 (S1), 0.8035 (S2), 0.8000 (S3).
• Resistance: 0.8140 (R1), 0.8200 (R2), 0.8246 (R3).
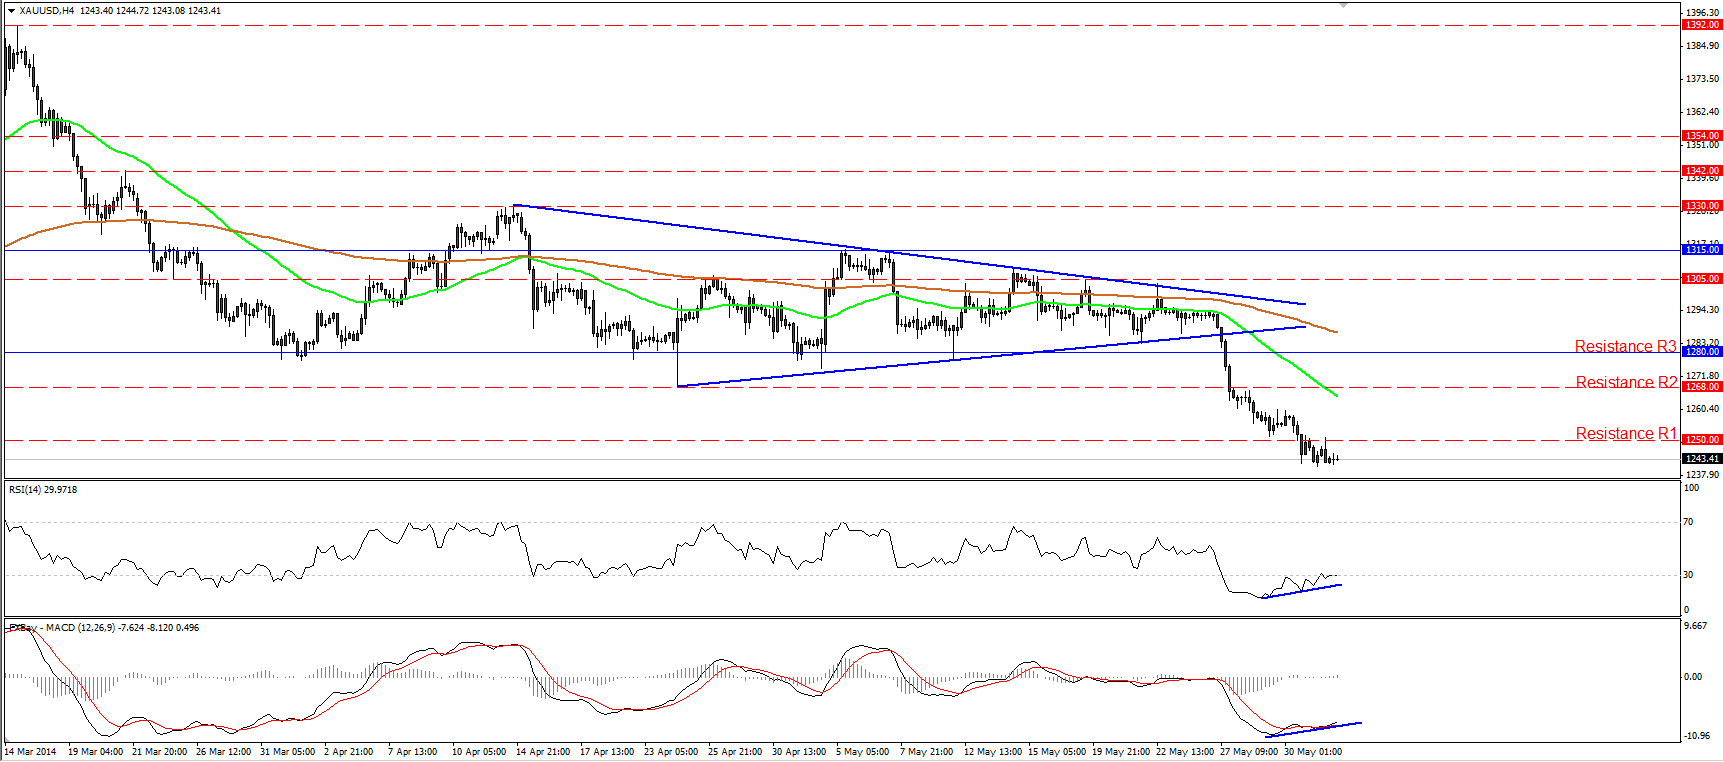
Gold remains below 1,250
Gold moved in a consolidative mode, remaining below the 1250 barrier. I still expect the bears to push the precious metal lower and target the support level of 1235 (S1), slightly above the 161.8% extension level of the triangle’s width. The RSI, already in its oversold zone, is testing its 30 level, while the MACD, in its negative territory, crossed above its trigger line. Moreover, we can identify positive divergence between both our momentum studies and the price action. As a result, I cannot rule out further consolidation or a move above the 1250 (R1) barrier before the bears prevail again.
• Support: 1235 (S1), 1218 (S2), 1200 (S3) .
• Resistance: 1250 (R1), 1268 (R2), 1280 (R3).
WTI within a downtrend channel
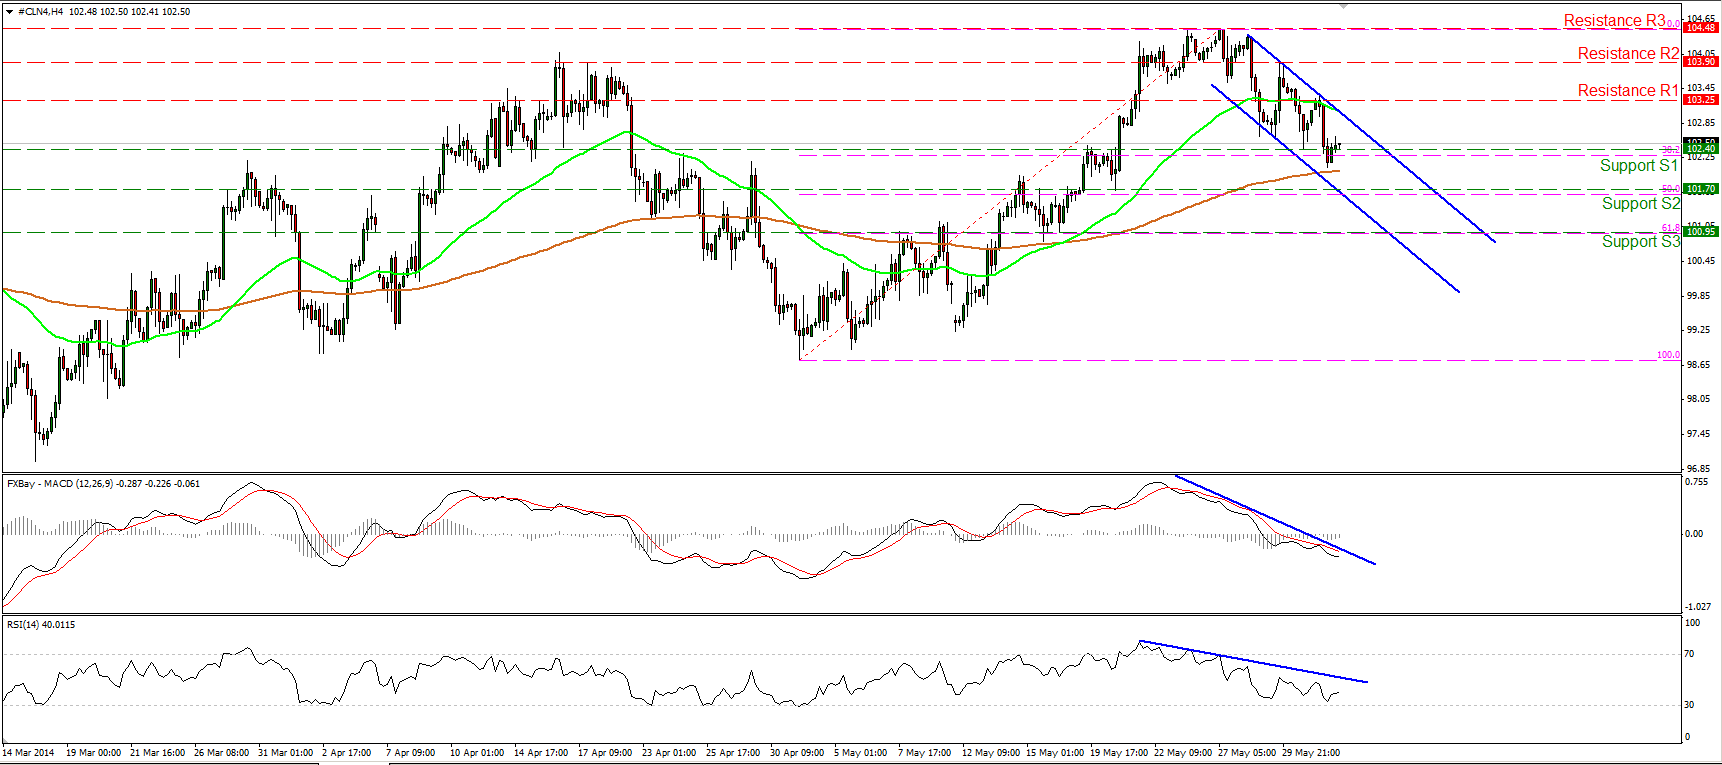
WTI moved lower and tried to overcome the 102.40 (S1) support, near the 38.2% retracement level of the prevailing short-term advance, but failed to do so. However, the price remains within the blue downward sloping channel and this keeps the outlook to the downside. A successful move below the aforementioned support zone could target the hurdle of 101.70 (S2) near the 50% retracement of the prevailing uptrend. Both our momentum studies remain below their blue resistance lines, keeping the momentum negative.
• Support: 102.40 (S1), 101.70 (S2), 100.95 (S3).
• Resistance: 103.25 (R1), 103.90 (R2), 104.48 (R3).


