TSMC Q2 profit soars 61% to record high; sees AI demand offsetting forex headwinds
The markets have been rising recently on "hopes" that Central Bankers around the world will unite into one big giant "funding-palooza" and resolve the Eurozone crisis conclusively. While the reality is that world wide bailouts will not resolve what ails the Eurozone - the markets are salivating at the prospect of another liquidity driven push higher in asset prices. However, there is a disconnect between the "hope" trade and the reality of deteriorating fundamentals and economics.
There is no doubt, however, that "psychology" can certainly drive the markets in the short-term, while longer term, it is fundamentals and economics that are the "gravity." Eventually, stock prices will revert to reality. Regardless of our longer term outlook - the recent "hope" driven speculation has driven asset prices far enough to reverse our short-term "sell signal," which was originally triggered back in April, to a "buy."
Since we use weekly signals to reduce asset turnover in portfolios - by the time a technical signal occurs, the market, on a very short-term basis, is either overbought or oversold. Therefore, it pays to either wait for a pullback to add equity exposure or a rally to reduce it.
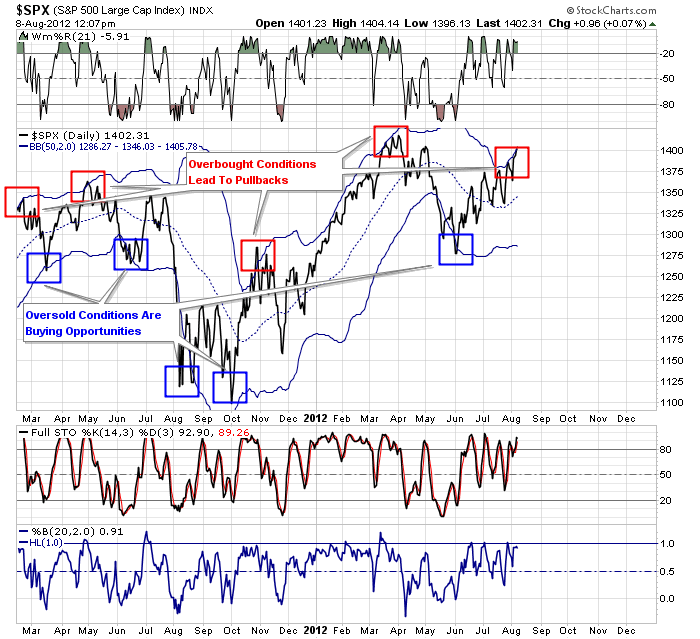
Currently, the market is both greater than 4% above its 50-day moving average and is more than 2-standard deviations overbought. To explain this a little more clearly I use an analogy of a rubber-band. Prices can only move so far in one direction before they "snap back" much in the same way that a rubber-band can only be stretched so far in one direction.
Historically speaking, and as shown in the chart, when prices reach 2 standard-deviations from their mean (or average price) they tend to revert back to the mean or beyond. This can generally happen very quickly. With the markets currently at short-term extremes it will be far more prudent to be patient and wait for a correction before adding further exposure to portfolios. 
The obvious question, therefore, is how much of a correction should we expect currently and under what conditions should equity risk be increased.
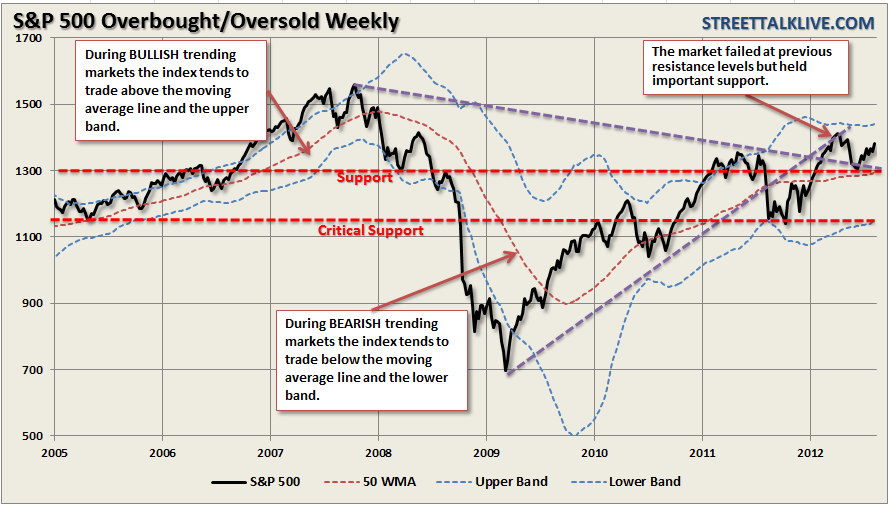
The second chart shows the S&P 500 on a weekly basis in order to smooth out the day to day volatility of the indexes. In May the market failed to move above the long-term upward trend (lower purple dashed line) after breaking it during last summer's sell-off.
This leaves the previous uptrend a major point of resistance for the market in the future. However, the sell-off did hold the important support at the 50 week moving average (red dashed line) and the downtrend line (upper purple dashed line) from the market peaks in 2008. 
With the market currently overbought, and sentiment becoming much more bullish as we discussed yesterday, it is very likely that a short-term correction could occur pulling prices back towards 1300 on the S&P 500. Provided that support holds at those levels, and the markets work off some of its current over bought condition, it will provide a much more opportune entry point for adding additional equity exposure.
This is a bit of a confusing time for investors emotionally speaking. There is no doubt that the fundamental, and economic, backdrop do not support a sustained market advance from current levels. Secondly, the markets are running up on "hope" of more central bank action, however, the very run up itself is likely to keep the Fed on the sidelines which will potentially disappoint the markets.
Finally, bonds are not confirming the recent rally as money continues to chase yield and safety. However, the market, as shown in the second chart, continues to trade above the 50-week moving average which indicates a continued bullish trend for the time being. Therefore, as we head into the seasonally strong time of the year, it is important that we maintain a level of equity exposure accordingly. However, we need to be patient for better risk/reward entry points to limit risk.
I am not dismissing the macro risks that are currently plaguing the economy. It is very likely that at the current rate of deterioration that we will see negative prints to GDP by the first quarter of 2013 at the latest. The trend of the data is clearly negative. Exports now account for a historical record percentage of GDP and make up an estimated 40% of corporate profits since the end of the last recession.
This is not a trivial point given the recession in Europe, and slowdown in China, which will continue to negatively impact corporate profitability putting fundamental valuations at risk. The impact to corporate profits is going to drive corporations into more defensive stances leading to more cost cutting, less employment and pushes for higher productivity. None of this bodes well for the economy or the markets over the next few quarters.
This is why I continue to reiterate that the fundamental backdrop is not supportive of a strengthening economy, or higher stock prices, and why there will eventually be "hell to pay." In the meantime, however, the markets can remain "irrational" longer than expected which is why we follow our signals and manage risk accordingly. Could the current short term "buy" signal be a "head fake" - absolutely. These signals are not infallible. However, they are right more often than they are wrong and keeps our "emotional bias" out of the portfolio management process.
Which stock should you buy in your very next trade?
With valuations skyrocketing in 2024, many investors are uneasy putting more money into stocks. Unsure where to invest next? Get access to our proven portfolios and discover high-potential opportunities.
In 2024 alone, ProPicks AI identified 2 stocks that surged over 150%, 4 additional stocks that leaped over 30%, and 3 more that climbed over 25%. That's an impressive track record.
With portfolios tailored for Dow stocks, S&P stocks, Tech stocks, and Mid Cap stocks, you can explore various wealth-building strategies.
