I last wrote about the comparison of three Major Indices with their Volatility Index counterparts on January 4th. While that post looked at a longer time period and mentioned major support and resistance levels, I'll provide an update for the shorter term.
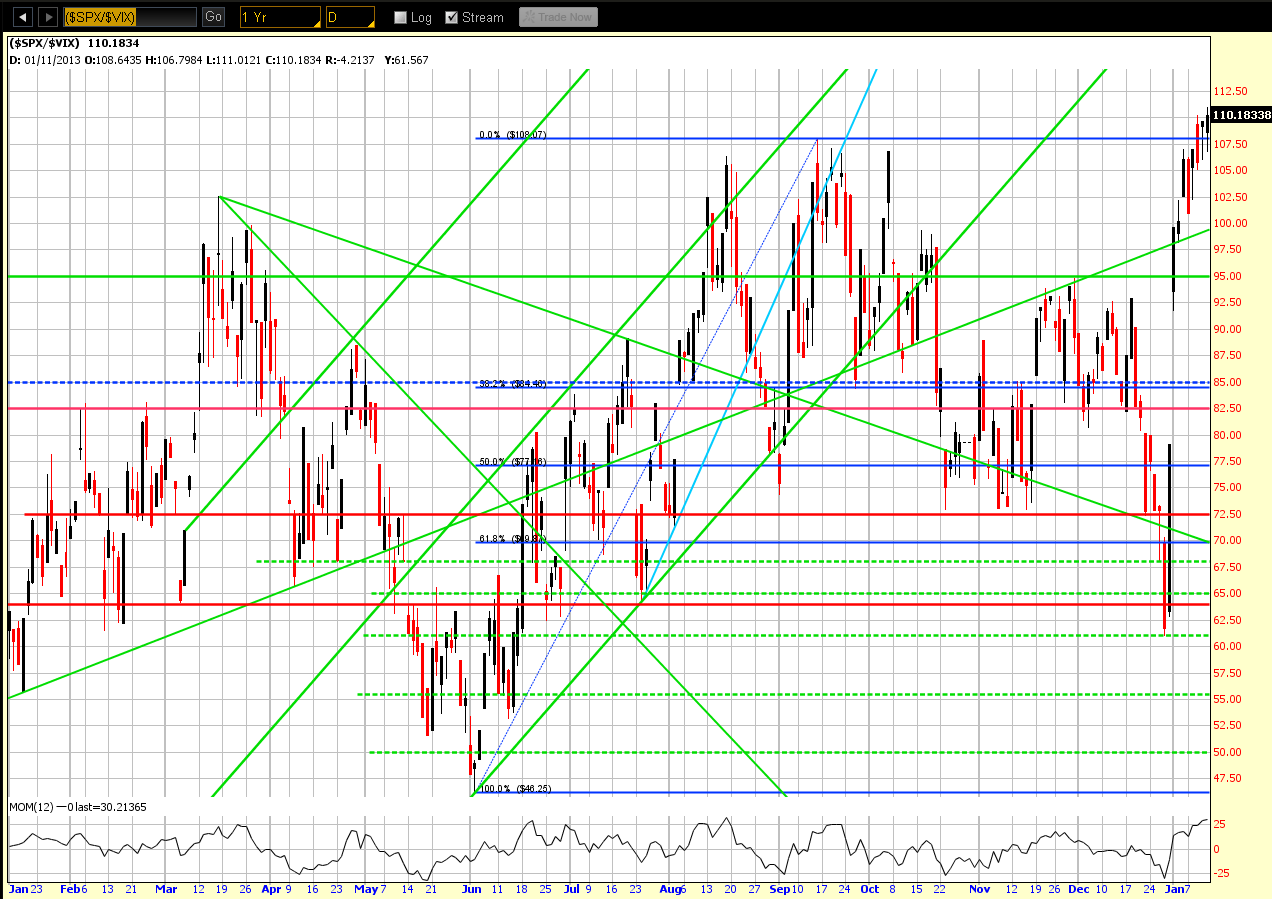
As shown on the 1-Year Daily ratio chart below of the SPX:VIX, price closed on Friday at new highs. The Momentum indicator is still rising, but is approaching overbought territory -- cautioning that we may see a minor pullback in the near future, although there is no negative divergence. If we do see a minor drop, followed by a higher swing high in price on negative Momentum divergence, we may then see a larger pullback -- if not, then I'd look for a further rally in the SPX.
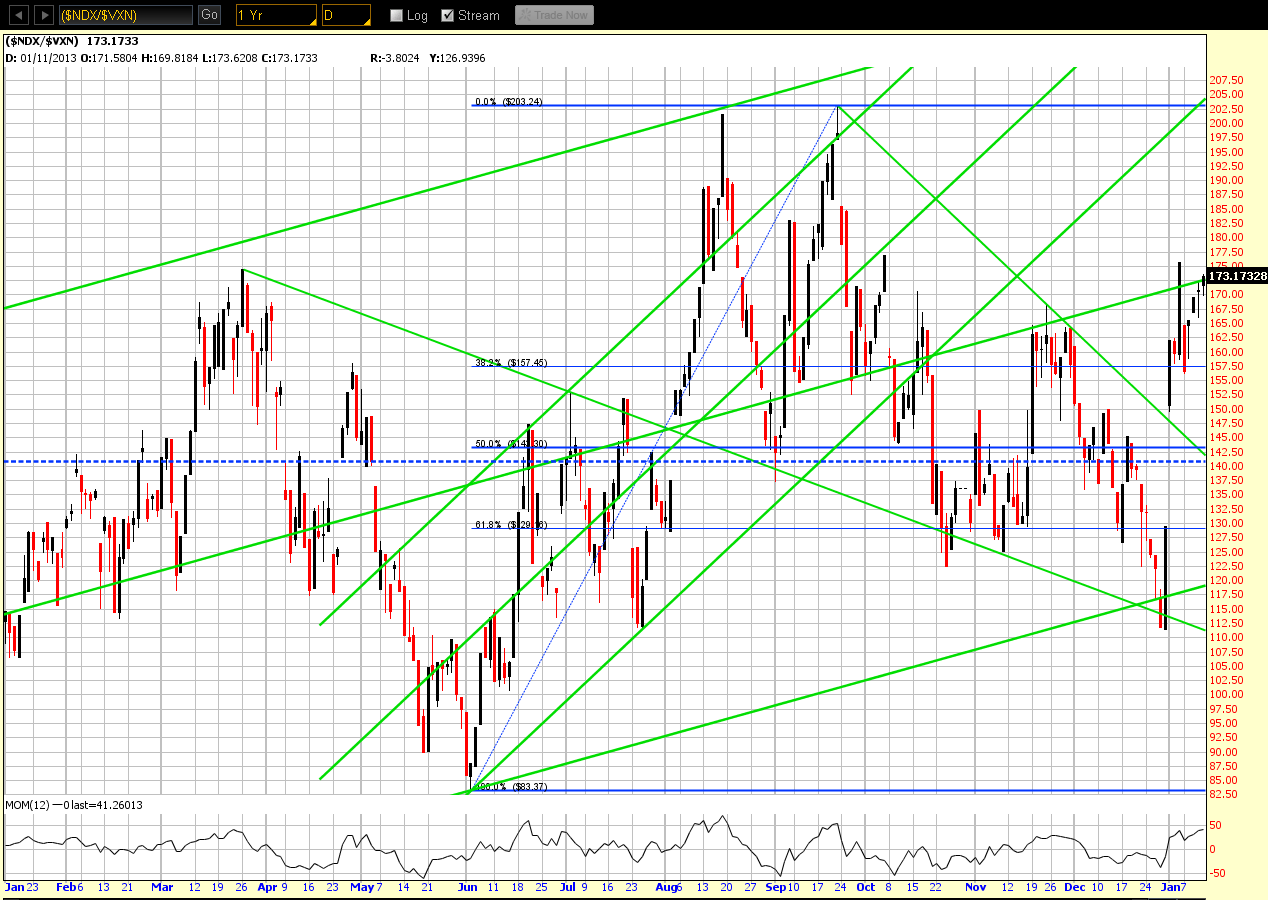
As shown on the 1-Year Daily ratio chart below of the NDX:VXN, price dropped then rallied this past week to close just below the last swing high. The Momentum indicator is still rising on positive divergence and still has a little way to go before it reaches the overbought territory. As I mentioned in my last post, we'll see if the NDX plays "catch up" with the other Major Indices, and this is one way to measure its strength.
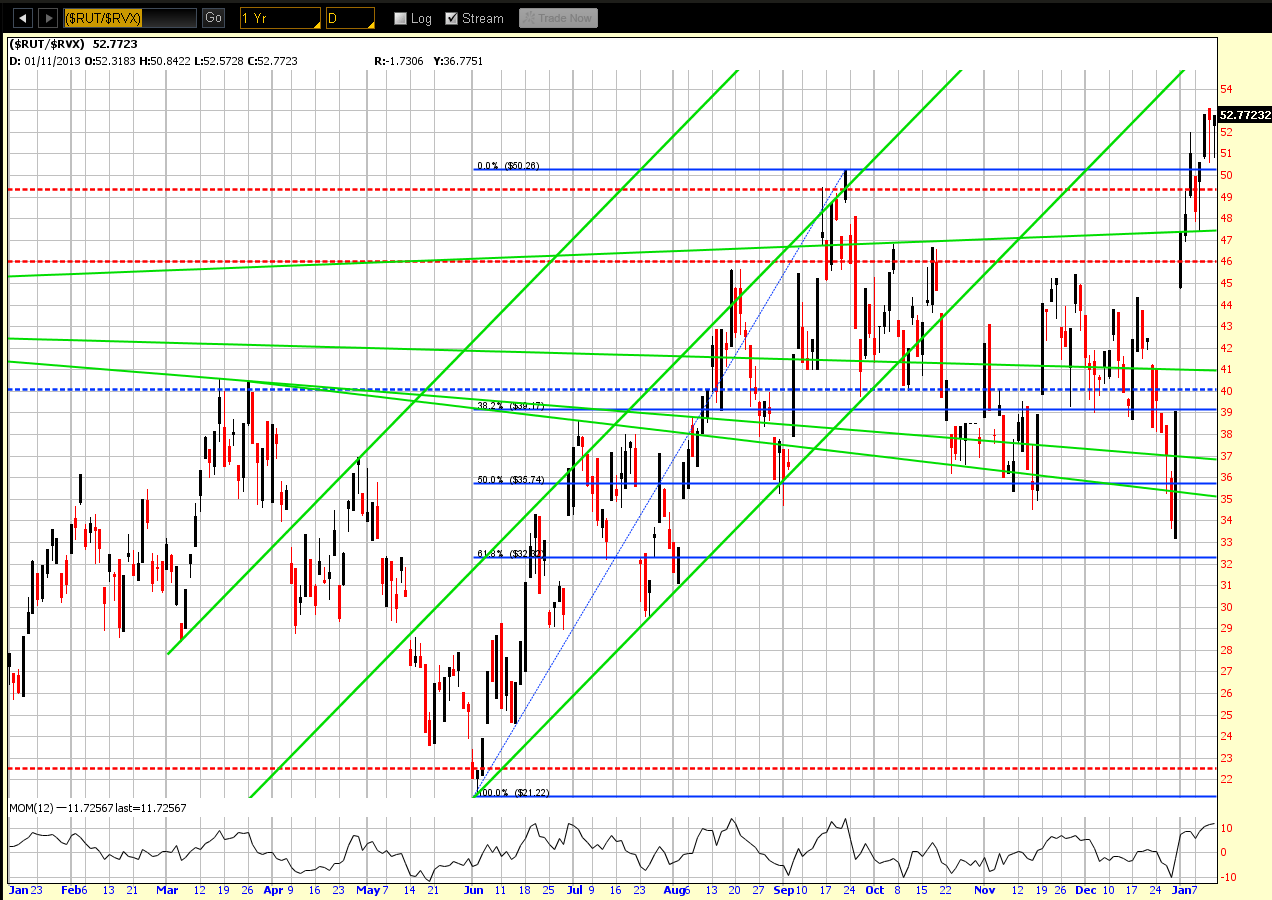
As shown on the 1-Year Daily ratio chart below of the RUT:RVX, price closed near Wednesday's all-time high. The Momentum indicator is still rising and positive, but is approaching overbought territory -- cautioning that we may see a minor pullback in the near future, although there is no negative divergence. If we do see a minor drop, followed by a higher swing high in price on negative Momentum divergence, we may then see a larger pullback -- if not, then I'd look for a further rally in the RUT.
In conclusion, we may not see any relevant build in volatility until we get closer to the "Fiscal Cliff" and "Debt Ceiling Limit" deadlines around the end of February or early March.
Which stock should you buy in your very next trade?
With valuations skyrocketing in 2024, many investors are uneasy putting more money into stocks. Unsure where to invest next? Get access to our proven portfolios and discover high-potential opportunities.
In 2024 alone, ProPicks AI identified 2 stocks that surged over 150%, 4 additional stocks that leaped over 30%, and 3 more that climbed over 25%. That's an impressive track record.
With portfolios tailored for Dow stocks, S&P stocks, Tech stocks, and Mid Cap stocks, you can explore various wealth-building strategies.
