
While the wider media want to focus your attention on the buying spree known as “Cyber Monday” today, traders may want to take a larger look at the impact of price action in the dollar index as November comes to a close.
Why you ask? Because it’s a technical D-Day for the almighty dollar.
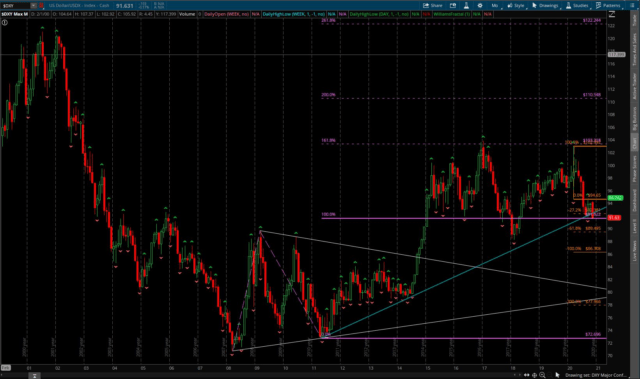
Take a look at the monthly chart above and consider the following:
I. 91.622 represents the AB=CD measured move off the monthly chart going from the:
a. 2008 low to the 2009 high
b. 2009 high down to the 2011 low
c. Projecting the move from the 2008 low to the 2009 high from that 2011 low
Of note, the highest point (so far) of this dollar bull move off the 2008 low ended slightly above a 1.618% extension of the same move (103.318).
II. Couple of things to note about why this is significant.
- That move up off the 2008 to the 2009 high marked the low and high points of a more than six-year wedge compression.
- The trendline up off the projection point (2011 low) has held as support until the end of last week on a closing weekly candle basis.
III. Now if we see the dollar index head lower as myself and others believe the chart pattern suggests will occur, here are some reasonable longer-term bear targets beneath.
a. 89.495 as a 61.8% inverted extension of the COVID-19 volatile total range the March 2020 candle formed
b. 89.107 to 88.253 being the lowest monthly candle close and low prior to the the recent swing up (again referencing the monthly chart). It also includes multiple prior key highs from 2008, 2009, and 2010
IV. Now for a rather “crazy” bear target, which would imply disastrous effects for the value of the U.S. dollar:
a. 77.966 Depending on the speed with which that target gets hit, it would be a 200% inverted extension of the range of the March 2020 COVID-19 volatile candle; As well as hit one of two trendlines that formed the wedge from 2008-2014 (either the uptrend line off the lows or the down trendline off the highs).
Of course, this could all be a move by larger forces to find a huge pool of liquidity from which to push the dollar higher.
But the evidence we’ve seen from gold, silver, crypto currencies, and non-liquid traded products (think artwork, etc.) suggests the larger trend for the dollar is down.