Trend Change Signal Requires a Flash Crash
Glenn Neely has written about what he calls a “well-established concept” of his Neowave system that the beginning of a trend change is marked by a move in the new direction bigger and faster than any previous move in that direction since the start of the existing trend.
I like and recommend Neely’s book. I’ve never back tested this concept. But I’ve back tested other Neely rules and set-ups and I’ve found them in general to be money-makers.
In any case, in the present situation, with a market that has been trending up since early 2009, according to Neely’s concept we’d know a bear market had started if we saw a single candle down on the S&P 500 or SPDR S&P 500 (ARCA:SPY) or S&P 500 Futures daily bigger and faster than any other single candle down on those charts since the March 6, 2009 low.
The biggest, fastest decline since the 2009 low was the May 6, 2010 flash crash, in which SPY dropped 12 points and the SPX and ES roughly 120 points.
So, if we come upon a trading set-up with a likely target more than 12 points below on SPY (or 120ish points below on the SPX or ES) the set-up has the potential of not only being a crash set-up, but also the start of a much bigger bear market correction.
On the other hand, if ES dropped 121 points, but it took eight days for the price to travel that distance, it would not meet Neely’s time rule. Basically, the price has to break out and crash 121+ points in less than a day in this spot.
One of the great things about the Neely rule is that a crash of 121+ points would mean The Top was in. You wouldn’t have to worry about a topping formation putting in a higher high.
Components of Good Crash Set-Ups
You tend to get crashes of the type that would meet Neely’s requirements in very obvious triangles or megaphones or head and shoulders patterns or price channels or other clear trading ranges. For example, if everyone is positioned for a triangle to break out upwards, but instead the breakout fails and the price heads back down into the triangle, the price would often melt down to the obvious target of the triangle bottom.
Not only are a lot of people positioned wrong in that type of set-up, leading to a melt-down as they scramble to get out, but nobody else wants to buy into the scramble before the price reaches the obvious target.
And if the price then broke out of the triangle bottom, and there was an obvious potential head and shoulders on the chart with a neckline far below, the price would often melt down to the H&S neckline.
Crashes happen when there’s no bid and market-makers are accumulating unwanted inventory. Market-makers start taking the price down faster and in bigger leaps trying to entice someone else to step in and bid into all the selling. If there’s an obvious target below, the entire market tends to wait for it, so the market-makers tend to melt the price down to that target. Then other buyers will usually step in, if only to close out shorts for an expected rally.
And that’s how you get a crash.
SPY and ES Have a Potential Crash Set-Up On Their Charts Now
SPY and ES have beautiful potential crash set-ups on their charts right now that have the potential to meet the requirements of the Neely trend-change signal.
Here are the details of the set-ups. There are more set-ups than I can easily write about in a single post, so I’m going to focus on just a few.

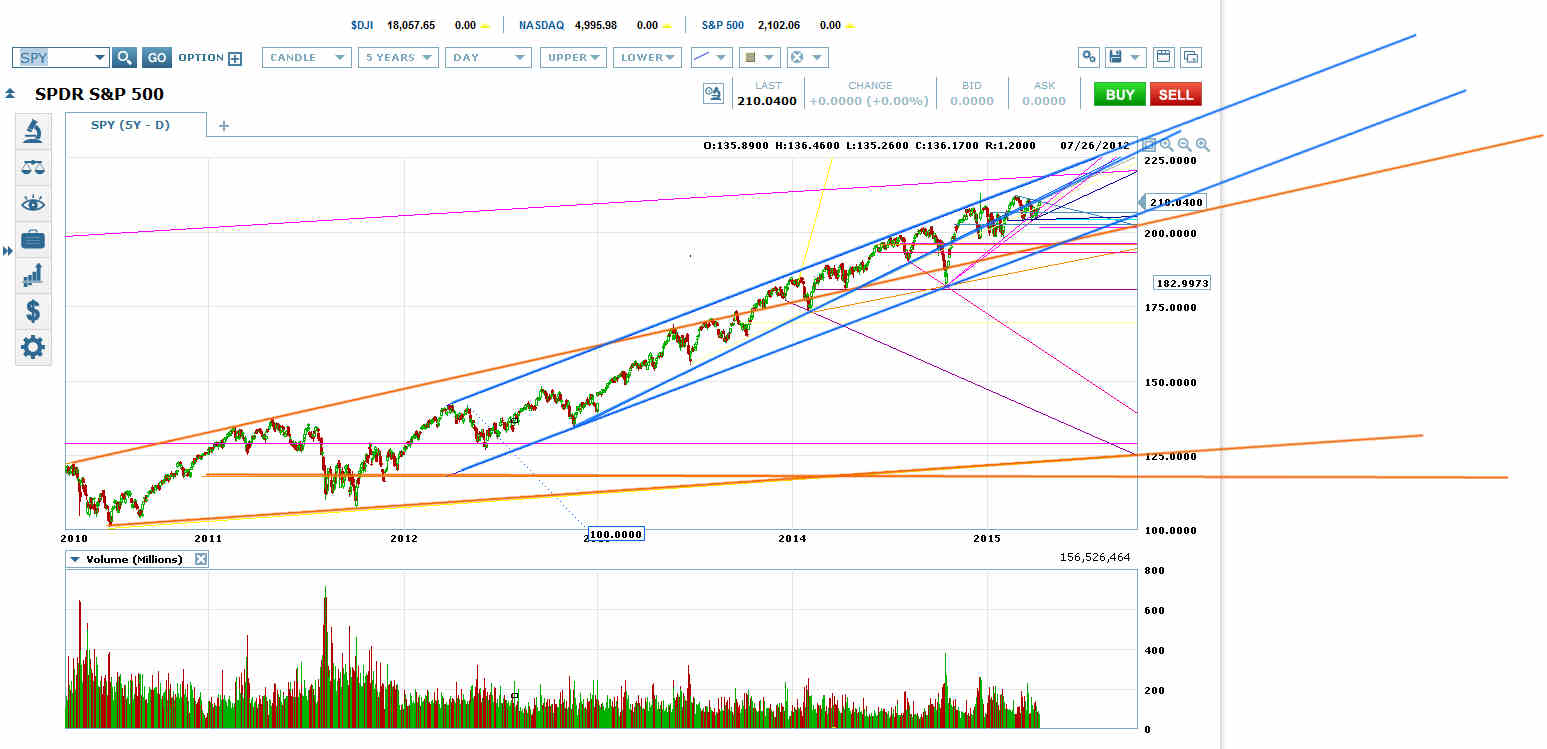
1. Obvious Price Channel Requires Trip to Bottom Roughly 140 Points Below
SPY and ES have a long-term price channel on their charts (bright blue on chart above). SPY and ES are in their critical decision waves within this price channel. That means they are in the wave where they either break out through the top to set up a blow-off move into a series of steeper channels, or they quickly return to the channel bottom to continue the move up the channel, or they start forming the top for the entire channeled move.
A breakout through the top for a move into a series of steeper channels usually happens quickly upon reaching the top. In these cases, an obvious price channel can’t contain the force of the move up.
But that didn’t happen in this case. Instead ES and SPY have touched the top three times since late November 2014, then tried again to touch it and failed. That means a breakout upwards from the channel is extremely unlikely.
ES and SPY also failed to turn quickly at the top for a standard dip to the bottom to continue the price move up the channel.
That means we’re likely in scenario three, which means ES and SPY are likely forming The Top for the entire channeled move.
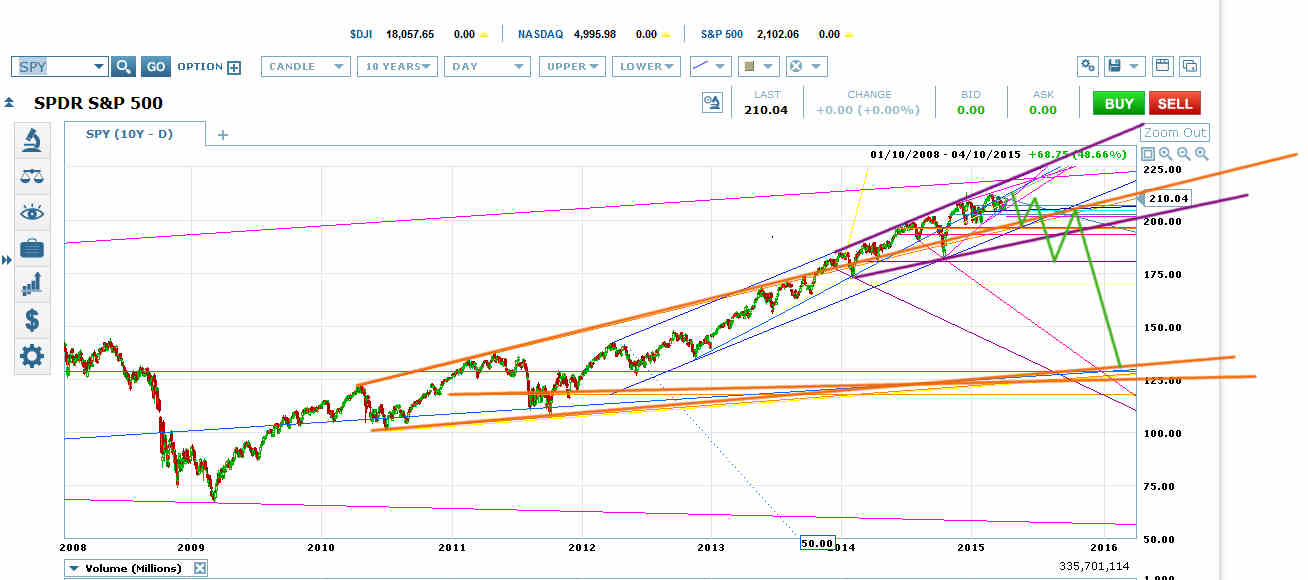
2. H&S in Major Rising Megaphone Top Targets Neckline 140 Points Below

ES and SPY have been forming a rising megaphone (orange on chart above) since 2010. Rising megaphones are essentially Sornette bubble formations.
To complete, rising megaphones either break out the top to form a smaller topping pattern, or they tag the top on the final wave up and then form an internal topping pattern (usually a head and shoulders or megaphone) that works the price sideways before the breakout downwards.
You often see a rising megaphone top on a rising megaphone, and that’s what we got on the ES and SPY charts (purple in chart above).
Since putting in its 3rd and final wave to the top, the purple rising megaphone has been working on an interior head and shoulders or megaphone. Again, this type of top tends to work the price sideways to the formation bottom for breakout.
ES and SPY are likely in the head of that head and shoulders right now, completing a topping formation on the head before a plunge to the neckline roughly 137 points below.
Then you could expect a right shoulder before a plunge to the purple megaphone VWAP at ES 1800/SPY 180, which would set up a still larger head and shoulders pattern.
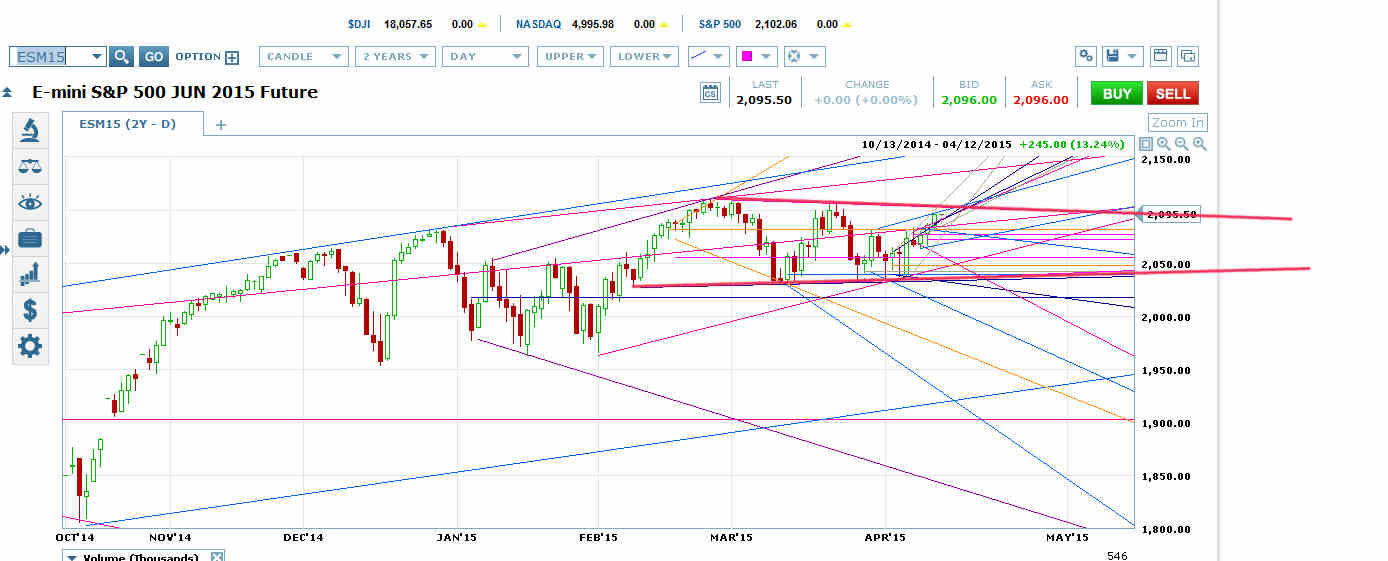
3. ES Triangle Likely to Break Out Downwards

ES has been forming a triangle since late February (the bottom line of the triangle connects to the February 9 bottom of a small retrace).
Usually a triangle in this spot would break out upwards, often to put in the head of a smaller head and shoulders, with a traditional triangle target roughly 80 points higher.
And I do expect this one to put in a fake breakout upwards that may go as far as putting in a new all-time high.
But there are several tells that this triangle is unlikely to put in a real breakout upwards to anywhere near its technical target.
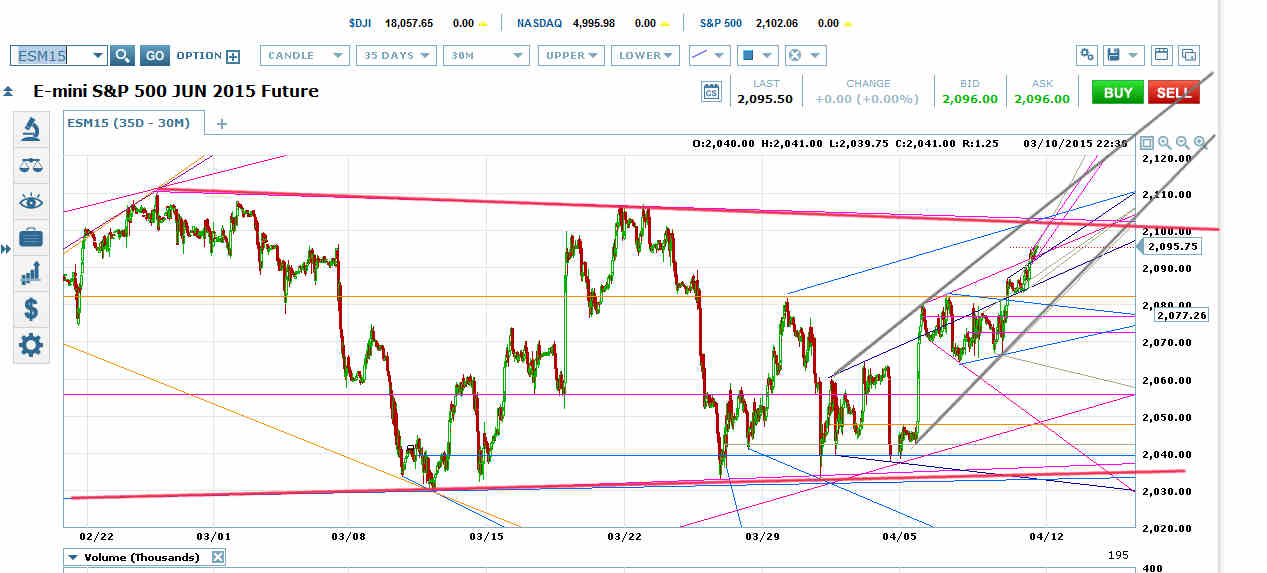
1. Last Low was an Exact Touch on Triangle Bottom
First, the last touch on the bottom of the triangle was an exact tag of the line. The exact touch means that turn was created by little-guy technical traders. Triangles don’t put in real upward breakouts after exact touches on the bottom.
2. Interior Irregularities, Including Rising Wedge to Triangle Top

Second, there are numerous irregularities in the internal construction of this triangle. For one thing, the price is getting to the top only through a series of interior megaphones and interior topping megaphones that I have written about in earlier posts.
That is weird. It should not take megaphone whipsaws and stop runs to get a price back to the top at this point in an obvious triangle. At this point, the price should have melted up straight from the bottom to the top (and through it).
Plus, all of the megaphones that went into the price rise to the triangle top require retraces. There can be no genuine breakout from this triangle while it requires retraces for interior megaphones.
In some cases, the likely target for an interior megaphone retrace is the megaphone bottom, and it is already outside the bottom of the triangle.
ES has also put in a rising wedge (silver on chart) on this trip to the megaphone top. A rising wedge is a topping pattern. It represents selling into buying–a pro move.
In a normal triangle, all the selling would come from little-guy traders up near the formation top.
These are all traits of topping triangles.
Topping triangles put in fake upwards breakouts before a genuine downward breakout. If we don’t see a small breakout through the top of the triangle here, we will likely see another move to the bottom, then one more move to the top to put in the fake breakout.
And the triangle could continue past that. Basically, the longer the price stays in this triangle, the more likely it is to break out downwards.
Which stock should you buy in your very next trade?
AI computing powers are changing the stock market. Investing.com's ProPicks AI includes 6 winning stock portfolios chosen by our advanced AI. In 2024 alone, ProPicks AI identified 2 stocks that surged over 150%, 4 additional stocks that leaped over 30%, and 3 more that climbed over 25%. Which stock will be the next to soar?
Unlock ProPicks AI
