Futures muted, Trump on copper tariffs, Fed minutes ahead - what’s moving markets
For the past several months, the most historically reliable leading data have indicated that the development of a recession in the US is likely during 2012. Coincident data in Europe have already signaled a return to economic contraction throughout the euro zone and the trend has turned lower in the US, suggesting that the global synchronized recession scenario is becoming more likely. In his latest weekly commentary, fund manager John Hussman reviewed the latest data trends and economic outlook.
For nearly two years, the massive interventions of central banks have repeatedly pulled a fundamentally weak and debt-burdened global economy from the brink of resumed recession. The Federal Reserve is now leveraged 52-to-1 against its own balance sheet, with assets having an average duration of over 5 years, suggesting that if those assets were marked-to-market, an interest rate increase of less than 50 basis points would wipe out the Fed’s entire capital base. Of course, the Fed takes no marks on its assets when it reports its balance sheet, though it does occasionally take down the value of the securities in the Maiden Lane shell companies that it illegally set up to bail out Bear Stearns and other entities (in violation of Section 13(3) of the Federal Reserve Act, which Congress had to amend and spell out like a See-Spot-Run book as a result).
At a 10-year Treasury yield of 1.7%, interest on reserves of 0.25%, and a monetary base now at about 18 cents per dollar of nominal GDP (see Run, Don’t Walk), further purchases of long-term Treasury securities by the Fed would produce net losses for the Fed in any scenario where yields rise more than about 20 basis points a year, or the Fed ever has to unwind any portion of its already massive positions. So further QE by the Fed would effectively amount to fiscal policy. Moreover, the benefits of central bank interventions are becoming progressively smaller and short-lived (nearly log-periodic in fact, to borrow a term from crash dynamics). None of this restricts the Fed from embarking on further interventions. It just emphasizes how far the Fed has already descended into the deep.
Oncoming economic weakness was already evident in a broad range of leading indicators late last summer, but it was clearly forestalled by the coordinated intervention of central banks, coupled with the “final” resolution of the Greek debt situation. While we observed a burst of economic activity early this year as a result, that burst was transient. Meanwhile, the evidence from a broad ensemble of leading indicators (including what we inferred from unobserved components models) remained weak, as did year-over-year economic measures that were less sensitive to high-frequency fluctuations and seasonal adjustment.
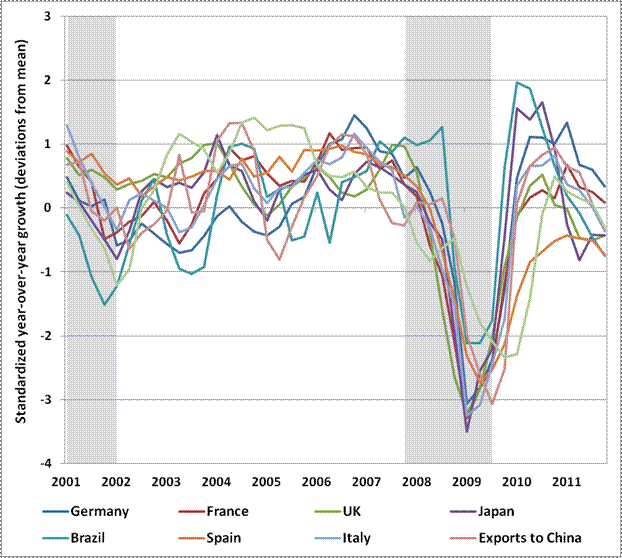
The uniform deterioration in global GDP growth was already evident even as 2012 began. The chart below presents normalized growth rates (mean zero, unit variance), which shows the co-movement across economies more clearly. It’s notable that across the world, normalized year-over-year GDP growth rates – even at the start of 2012 – were already jointly at levels worse than at the start of the previous two global downturns.
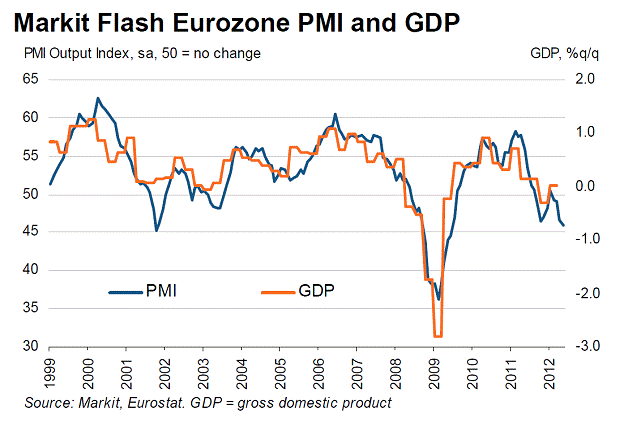
The chart below illustrates how conditions have progressed in the past few months. Note that the latest reading on the Eurozone PMI has dropped to fresh lows, breaking below the levels that accompanied the 2011 market swoon.
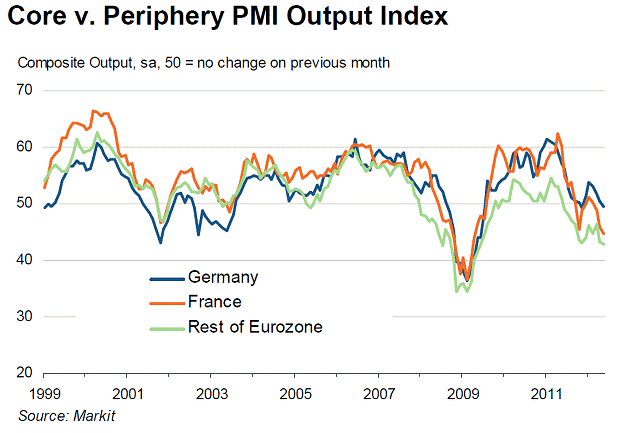
The deterioration across Europe is not simply restricted to peripheral countries. The steep decline in France is notable, while the German PMI has now dropped below 50 as well, reflecting the sharpest drop in manufacturing output in three years. Meanwhile, Lloyds TSB noted last week that the majority of regions in the UK reported their “weakest output performance in 2012 to date.”
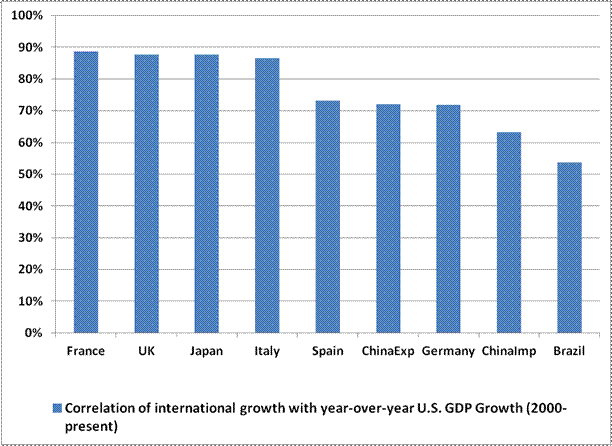
Of course, the argument from Wall Street is that despite clear evidence of recession across Europe, and significant slowdown or recession elsewhere in the world, the United States will somehow “decouple” and avoid recession. Reality hates to interfere, but the chart below presents the correlation between the GDP growth of several major nations (particularly in Europe) and U.S. GDP growth. The correlation with U.S. GDP – particularly in Euro-zone countries – is generally in the range of 70-90%.
If the global recession scenario continues to unfold as expected, the US stock market will almost certainly suffer substantial losses during the next 6 to 12 months as the accompanying cyclical bear market drives valuations lower. Therefore, we remain fully defensive from an investment perspective and recommend that you do the same.
Which stock should you buy in your very next trade?
AI computing powers are changing the stock market. Investing.com's ProPicks AI includes 6 winning stock portfolios chosen by our advanced AI. In 2024 alone, ProPicks AI identified 2 stocks that surged over 150%, 4 additional stocks that leaped over 30%, and 3 more that climbed over 25%. Which stock will be the next to soar?
Unlock ProPicks AI