
Today the Institute for Supply Management published its monthly Manufacturing Report for August. The latest headline Purchasing Managers Index (PMI) was 58.8 percent, an increase of 2.5 percent from 56.3 the previous month. Today's headline number was above the Investing.com forecast of 56.5 percent.
Here is the key analysis from the report:
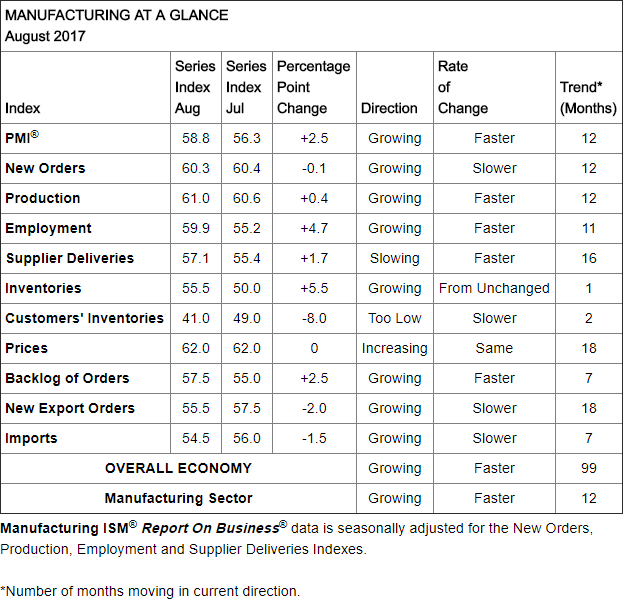
"The August PMI® registered 58.8 percent, an increase of 2.5 percentage points from the July reading of 56.3 percent. The New Orders Index registered 60.3 percent, a decrease of 0.1 percentage point from the July reading of 60.4 percent. The Production Index registered 61 percent, a 0.4 percentage point increase compared to the July reading of 60.6 percent. The Employment Index registered 59.9 percent, an increase of 4.7 percentage points from the July reading of 55.2 percent. The Supplier Deliveries Index registered 57.1 percent, a 1.7 percentage point increase from the July reading of 55.4 percent. The Inventories Index registered 55.5 percent, an increase of 5.5 percentage points from the July reading of 50 percent. The Prices Index registered 62 percent in August, the same reading as July, indicating higher raw materials’ prices for the 18th consecutive month. Comments from the panel reflect expanding business conditions, with new orders, production, employment, backlog and exports all growing in August, as well as supplier deliveries slowing (improving) and inventories increasing during the period. The Customers’ Inventories Index experienced a sharp decline in August compared to July."[source]
Here is the table of PMI components.
The ISM Manufacturing Index should be viewed with a bit of skepticism for various reasons, which are essentially captured in a previous Briefing.com "Big Picture" comment on this economic indicator.
This [the ISM Manufacturing Index] is a highly overrated index. It is merely a survey of purchasing managers. It is a diffusion index, which means that it reflects the number of people saying conditions are better compared to the number saying conditions are worse. It does not weight for size of the firm, or for the degree of better/worse. It can therefore underestimate conditions if there is a great deal of strength in a few firms. The data have thus not been either a good forecasting tool or a good read on current conditions during this business cycle. It must be recognized that the index is not hard data of any kind, but simply a survey that provides broad indications of trends.
The chart below shows the Manufacturing Composite series, which stretches back to 1948. The eleven recessions during this time frame are indicated along with the index value the month before the recession starts.
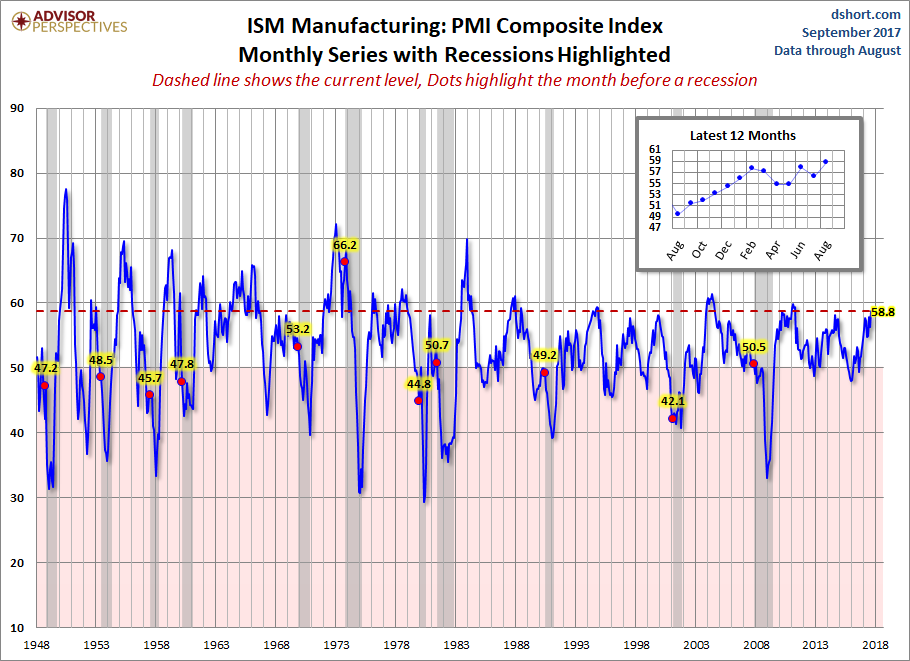
For a diffusion index, the latest reading of 58.8 is its twelfth consecutive month of expansion. What sort of correlation does that have with the months before the start of recessions? Check out the red dots in the chart above.
How revealing is today's 2.5 point change from last month? There are 836 monthly data points in this series. The absolute average month-to-month point change is 2.0 points, and the median change is 1.5 points.
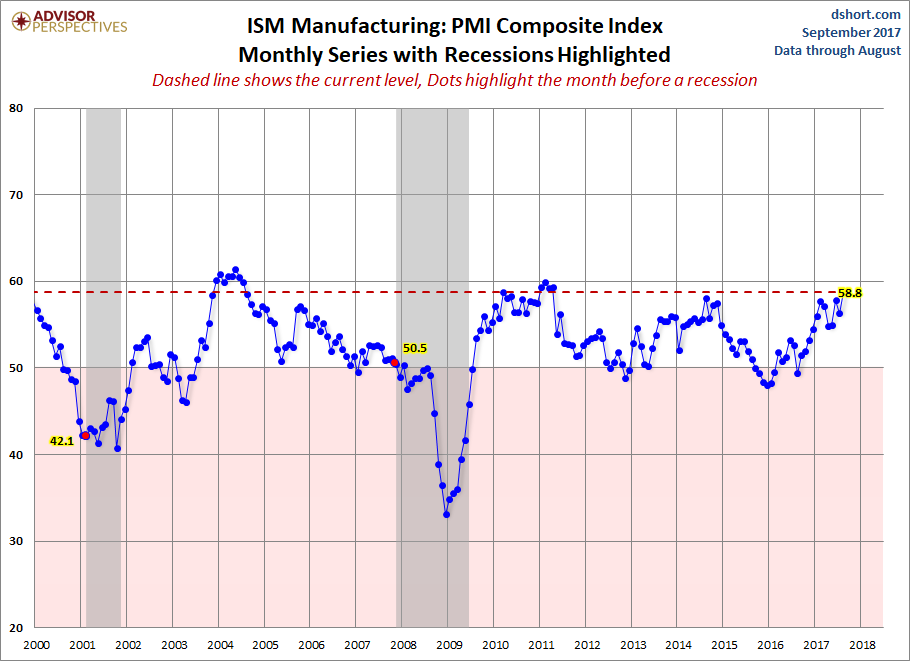
Here is a closer look at the series beginning at the turn of the century.
To reiterate the Briefing.com assessment: "The data have thus not been either a good forecasting tool or a good read on current conditions during this business cycle." The ISM reports nevertheless offer an interesting sidebar to the ongoing economic debate.
Note: This commentary used the FRED USRECP series (Peak through the Period preceding the Trough) to highlight the recessions in the charts above. For example, the NBER dates the last cycle peak as December 2007, the trough as June 2009 and the duration as 18 months. The USRECP series thus flags December 2007 as the start of the recession and May 2009 as the last month of the recession, giving us the 18-month duration. The dot for the last recession in the charts above is thus for November 2007. The "Peak through the Period preceding the Trough" series is the one FRED uses in its monthly charts, as illustrated here.
Which stock should you buy in your very next trade?
AI computing powers are changing the stock market. Investing.com's ProPicks AI includes 6 winning stock portfolios chosen by our advanced AI. In 2024 alone, ProPicks AI identified 2 stocks that surged over 150%, 4 additional stocks that leaped over 30%, and 3 more that climbed over 25%. Which stock will be the next to soar?
Unlock ProPicks AI