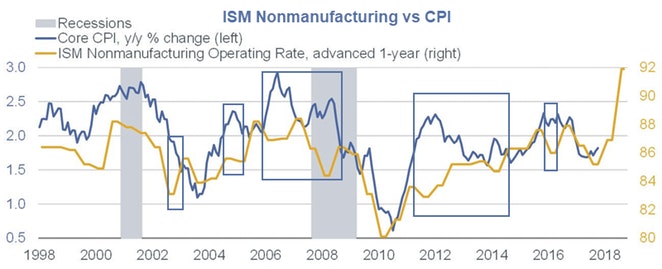
Here's an interesting chart from a tweet today. I cannot make heads or tails out of the proposed idea.
The Claim
The claim is the ISM's nonmanufacturing rate leads changes in core CPI by one year.
The results looks random to me. Correlation and inverse correlation are roughly equal.
The basic problem with these kind of charts is they presume something that happened a year ago has that much influence over events today.
It almost never works out because there are too many other variables. Thus, the boxes that I drew showing inverse correlation happen about 50% of the time.
This ISM variable predicts nothing, at least related to the CPI.
I am not doing this post to knock Sonders. She posts some great charts and lots of interesting ideas. Rather, I wanted to write about ISM anyway.
Survivor Basis
I had lunch yesterday with Jim Bianco, at Bianco Research. We had a great discussion about the ISM.
Since 2007, ISM membership has declined by about 33%. The companies that remain display a survivor bias. They made it through the great recession intact. And they tend to be more bullish.
Jim mentioned a Fed study that came to the same conclusion. The regional manufacturing surveys all have the same flaw.
Jim also mentioned that his firm gets polled in the ISM Nonmanufacturing survey. He has a handful of employees.
His firm has the same weight in the survey as Walmart (NYSE:WMT) which may be hiring or firing thousands of employees. I have mentioned this idea before, but now I have a concrete example to provide.
Questions Start in 2013

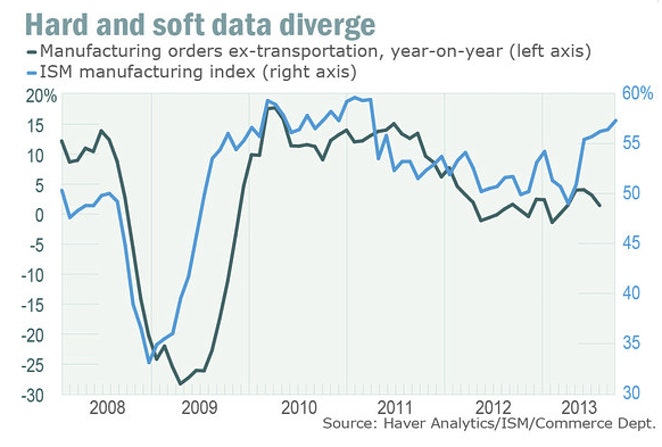
On December 2, 2013 MarketWatch commented ISM doubters waiting for hard data to confirm uptrend.
We have no real answer as to why, but given the underlying momentum in the ISM data we can only conclude that at some point the government reports fully reflect private-sector data such as ISM and railroad traffic,” says Steve Blitz, chief economist at ITG.
Stephen Stanley of Pierpont Securities says the nonfarm payrolls data for November — to be released on Friday — will be key. “It was easier to argue that the ISM looked fluky a few months ago. Now, either the ISM figures are giving us leading insight into an imminent boom, or they are just downright wrong. Given the long and storied track record of this indicator, it is difficult to imagine that the ISM figures could be totally off base for so long. And yet, I remain skeptical. I won’t fully believe in the robustness signaled by the ISM figures until I see it in the actual data on production, orders, and employment.”
Response Bias
Historical highs are all distorted not only by the survivor bias but by answering bias. Bianco stopped responding years ago.
How many others stopped responding? At what impact?
Here's a hint: None of the manufacturing reports match actual factory production and they haven't for years.
Think about the Dallas Fed region for a moment. When oil crashed, numerous businesses went under. There's a huge, recent survivor bias in the Dallas Fed region.
Bias Three Ways
We have survivor bias, answering bias, and some unknown ISM bias that started in 2013.
All of these diffusion index reports are so skewed they are historically useless if not entirely useless.
Which stock should you buy in your very next trade?
AI computing powers are changing the stock market. Investing.com's ProPicks AI includes 6 winning stock portfolios chosen by our advanced AI. In 2024 alone, ProPicks AI identified 2 stocks that surged over 150%, 4 additional stocks that leaped over 30%, and 3 more that climbed over 25%. Which stock will be the next to soar?
Unlock ProPicks AI
