Trump slaps 30% tariffs on EU, Mexico
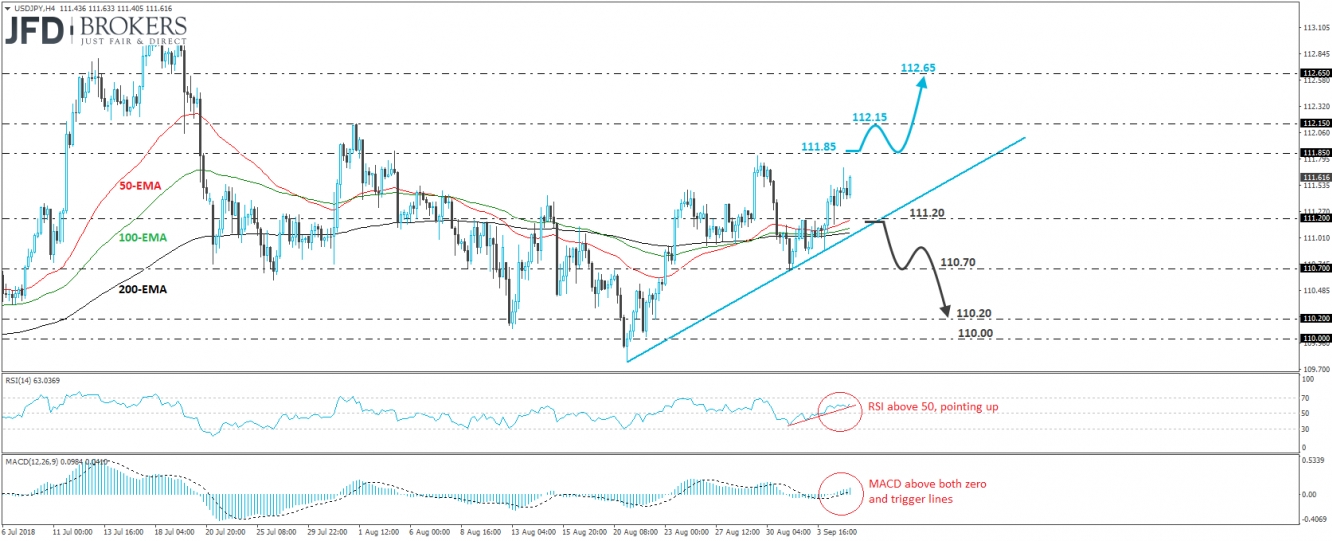
USD/JPY traded north on Wednesday, after it emerged above the resistance (now turned into support) barrier of 111.20 on Tuesday. The rate is trading above the upside support line drawn from the low of the 21st of August, which keeps the short-term outlook somewhat positive, but we prefer to wait for a decisive move above 111.85 before we get confident on larger upside extensions.
A clear break above 111.85 would confirm a forthcoming higher high on the 4-hour chart and is possible to pave the way towards our next resistance of 112.15, defined by the peak of the 1st of August. Another break above that level may invite more bulls into the action and could set the stage for the 112.65 hurdle, a resistance marked by the high of the 20th of July, as well as the inside swing low of the previous day.
Looking at our short-term oscillators, we see that the RSI lies above 50 and points north. It could be heading towards its 70 line. The MACD lies slightly above both its zero and trigger lines, pointing somewhat up as well. These indicators detect upside momentum and support the notion for USD/JPY to continue trading higher for a while more.
On the downside, we would like to see a clear dip below 111.20 and the aforementioned upside support line, before we abandon the bullish case, at least in the short run. Such a move could encourage the bears to push the rate towards the 110.70 zone, marked by the low of the 31st of August, the break of which could carry more bearish implications and perhaps open the path for the 110.20 level, or the psychological figure of 110.00.
Which stock should you buy in your very next trade?
AI computing powers are changing the stock market. Investing.com's ProPicks AI includes 6 winning stock portfolios chosen by our advanced AI. In 2024 alone, ProPicks AI identified 2 stocks that surged over 150%, 4 additional stocks that leaped over 30%, and 3 more that climbed over 25%. Which stock will be the next to soar?
Unlock ProPicks AI
