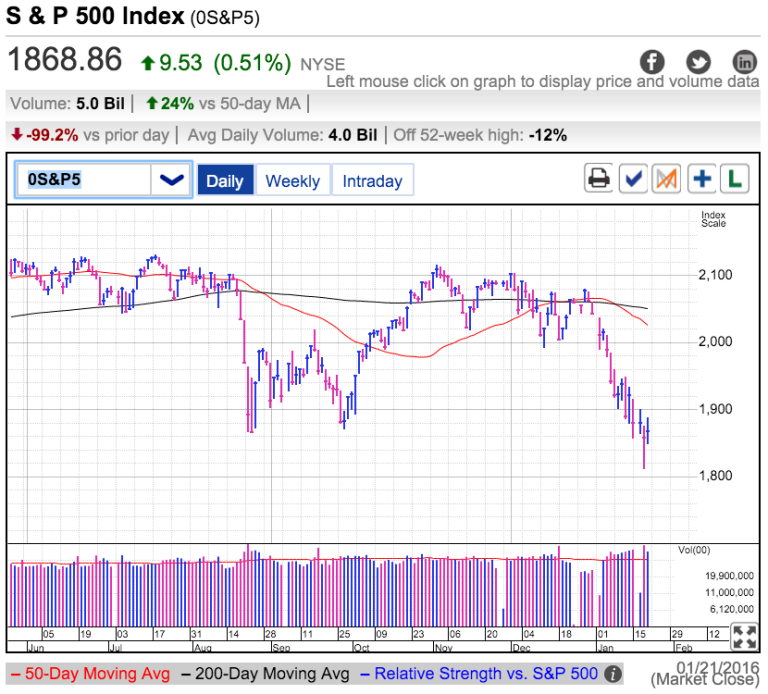
It’s been a dramatic couple of days. Wednesday the S&P 500 cratered over 3.5% in midday trade. But just when things looked their worst, we bottomed and recovered a majority of those losses with a powerful, 50-point rebound into the close. Volume was staggering and the second highest level in several years. The only day when more shares traded hands was August’s 5% bloodbath, a day also noteworthy for forming the bottom of the Fall selloff.

Thursday morning we slipped into the red but the situation changed decisively when the ECB hinted more stimulus is on its way in March. Then a less bad than feared U.S. oil inventory report sent crude spiking 5%. Between the apparent capitulation volume on Wednesday, more easy money from Europe, and rebound in oil, have we put in a bottom?
While Wednesday’s massive selloff did a lot of damage, it also purged most of the weak supply between here and 1,810. If anyone had a stop-loss, it was triggered when we plunged well beyond August’s lows. If an owner could have been spooked out, they were spooked out. But for every person who went running for cover, their was a bold buyer willing to take advantage of these emotional discounts. Removing weak owners and replacing them with confident dip-buyers is a very constructive development. Since we cleared most of the stop-losses under 1,850, it will be far harder for another dip under this level to trigger a runaway selloff.
But before we get too excited and start buying with reckless abandon, this correction fell well past the point where a V-rebound to previous highs can save us. This 10% selloff pushed us back into correction territory for the second-time in six-months and nerves are frayed. That means we should expect this erratic trade to continue as we carve out a base. Similar whipsaws occurred during the September bottoming and we should plan for the same choppiness here. In the near-term that means selling strength and buying weakness as we settle into a multi-month trading range. Be prepared for a retest of Wednesday’s lows at some point and expect regretful owners to flood the market with supply everytime we try to rally above 1,900. While it is tempting to trade our bullish or bearish bias every time the market feigns a breakout or breakdown, the best money over the next couple of months will come from trading against these moves.
Which stock should you buy in your very next trade?
With valuations skyrocketing in 2024, many investors are uneasy putting more money into stocks. Unsure where to invest next? Get access to our proven portfolios and discover high-potential opportunities.
In 2024 alone, ProPicks AI identified 2 stocks that surged over 150%, 4 additional stocks that leaped over 30%, and 3 more that climbed over 25%. That's an impressive track record.
With portfolios tailored for Dow stocks, S&P stocks, Tech stocks, and Mid Cap stocks, you can explore various wealth-building strategies.
