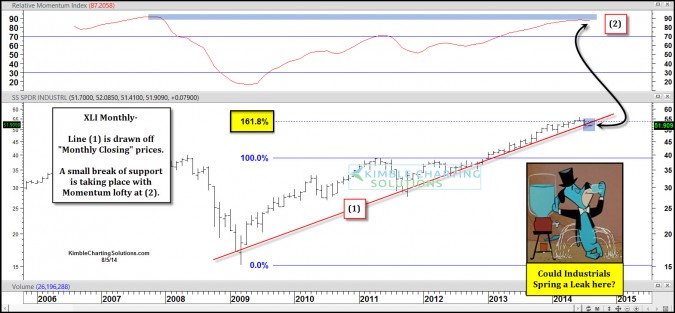
Industrials ETF (ARCA:XLI) recently hit a Fibonacci extension level based upon the 2009 lows and the 2011 highs. At the same time this key Fib level was setting in, momentum was reaching levels last seen in 2007.
In June the ETF created a monthly bearish wick, followed by a decline last month, taking it below support line (1) by a small percentage. This support line gains a little added importance with momentum reaching levels last seen in 2007.
Humbly I feel what the top-ten holdings of this ETF do going forward is really important. You might want to chart a few of these stocks to check and see if any key support breaks are taking place.
This would NOT be a good time for XLI to spring a leak. If it does, it would break the support line off the 2009 lows with momentum moving sky high.
Which stock should you buy in your very next trade?
With valuations skyrocketing in 2024, many investors are uneasy putting more money into stocks. Unsure where to invest next? Get access to our proven portfolios and discover high-potential opportunities.
In 2024 alone, ProPicks AI identified 2 stocks that surged over 150%, 4 additional stocks that leaped over 30%, and 3 more that climbed over 25%. That's an impressive track record.
With portfolios tailored for Dow stocks, S&P stocks, Tech stocks, and Mid Cap stocks, you can explore various wealth-building strategies.

