Is the economy already benefitting from an AI boom?
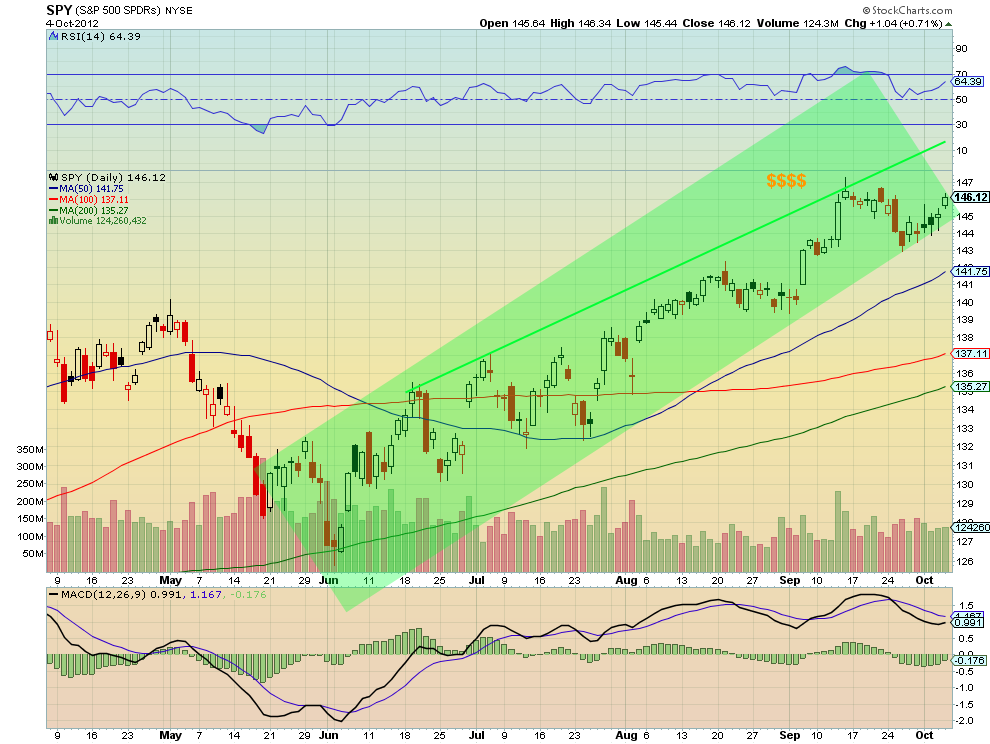
Traders and Investors look at a lot of indicators, statistics, and econometrics when they are trying to determine what will happen in the market. But the simplest indicator, price action, has been telling you for 4 months to be bullish. The chart of the S&P 500 SPDR (SPY) below has been in an uptrending channel since confirming the June 4 Hammer higher as the first indicator. Yes it has been meeting resistance lower in that channel as it has risen, but the resistance has been rising steeply.
S&P 500 SPDR (SPY)
All of the Simple Moving Averages (SMA) are rising. The Relative Strength Index (RSI) is rising and in bullish territory. Finally the Moving Average Convergence Divergence indicator (MACD) is moving towards a positive cross. If you need more convincing than that, then I suggest you stop watching television and reading the financial newspapers. No reason to even have one though about a move lower until a break of the channel. Maybe today, maybe not.
Note: The information in this blog post represents my own opinions and does not contain a recommendation for any particular security or investment. I or my affiliates may hold positions or other interests in securities mentioned in the Blog, please see my Disclaimer page for my full disclaimer.
Original post
Which stock should you buy in your very next trade?
AI computing powers are changing the stock market. Investing.com's ProPicks AI includes 6 winning stock portfolios chosen by our advanced AI. In 2024 alone, ProPicks AI identified 2 stocks that surged over 150%, 4 additional stocks that leaped over 30%, and 3 more that climbed over 25%. Which stock will be the next to soar?
Unlock ProPicks AI