Nvidia announces $100 billion strategic partnership with OpenAI, shares climb
Range bound strategies have proven to be some of the best trading techniques for currency pairs like the GBP/USD over the past few weeks, especially during the Asia session. DailyFX Research has found that trading during the Asia session using a range bound strategy on European currencies has been one of the most profitable approaches.
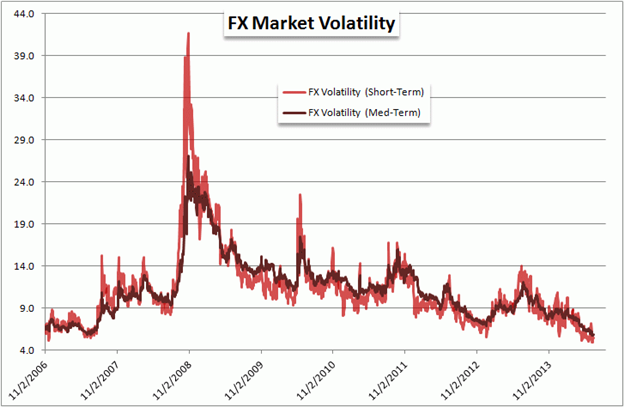
Volatility in the currency market is at multi-year lows, meaning that previously strong moving pairs have materially slowed. To keep the odds shifted towards a favorable balance, traders may consider adjusting to these conditions by moving from breakout and trending strategies over to a consolidation or range-bound approach.

Chart Created by John Kicklighter. Source: Bloomberg
For newer traders it can take countless hours to accurately judge prevailing market conditions. Moreover, it takes time to perform effective analytics, like deciding which indicator to use and how to identify the strongest levels of support and resistance. Fortunately, FXCM has designed applications to streamline this process. The DailyFX Support & Resistance Wizard has been created to plot three levels of support and resistance onto your charts. The levels are compiled by DailyFX Currency Strategist Ilya Spivak.
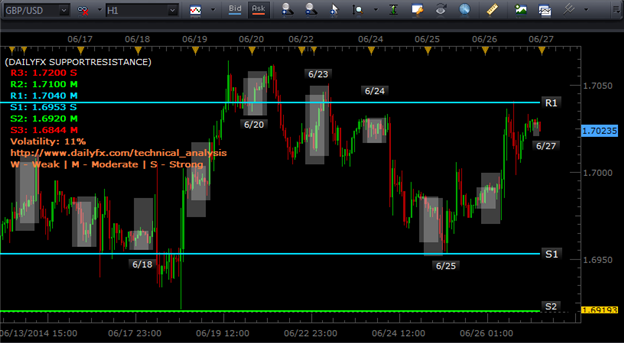
These levels can be best utilized in a ranging market by buying at support and selling at resistance. To help establish when the best time to trade is, FXCM created the Trading Sessions application, which highlights Asia market hours (as seen in the grey areas on the chart below).
When trading around the levels, it’s also important to note critical event risk. Major changes in monetary policy expectations can cause market volatility, pushing prices through technical barriers as asset valuations realign to policy expectations. On Friday, 6/27, revised gross domestic product figures will be released for the UK economy.
GBP/USD, 1-Hour Chart

The strategy works as follows:
On 6/18 the GBP/USD found support at S1 and moved lower to S2 where price rebounded and traded higher, finding resistance at R1 on 6/20. From 6/20 to 6/24, the market oscillated in a narrow range near the 1.7040 figure (R1) providing an opportunity for three entry points.
On 6/24 shortly after the Asia session ended the Sterling Dollar pair moved sharply lower for about 70 pips and found a sticking point at 1.6953 (S1) and stalled on 6/25.
When trading the range, and price is at support, the next opportunity to consider would be to look for price action to move up towards resistance. As anticipated, from 6/25 to 6/27, the currency pair ascended 80 pips through the range.
The strategy of buying at support and selling at resistance would continue until prices break and hold above R1 or below S1.
Disclosure: The DailyFX Support & Resistance Wizard and Trading Sessions application can be found by clicking on the links or by going to www.fxcmapps.com to trade the strategy. You can also get the applications for free by contacting your representative or customer service at 1.888.50.FOREX.
Which stock should you buy in your very next trade?
AI computing powers are changing the stock market. Investing.com's ProPicks AI includes dozens of winning stock portfolios chosen by our advanced AI.
Year to date, 3 out of 4 global portfolios are beating their benchmark indexes, with 98% in the green. Our flagship Tech Titans strategy doubled the S&P 500 within 18 months, including notable winners like Super Micro Computer (+185%) and AppLovin (+157%).
Which stock will be the next to soar?
