Reversal at Blue Price Channel Bottom would Usually Mean Much Higher High to Come – Breakdown to Orange Rising Megaphone Bottom would Usually Mean Top is In
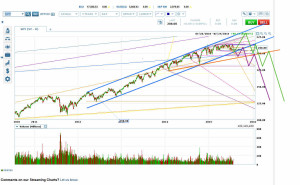
ES needs to tag the bottom of its blue 3-year+ price channel and it usually wouldn’t wait much longer to do it.
The tag of the 3-year+ price channel bottom would set up a complex H&S on the ES and S&P 500 charts. A breakout downwards from that would take ES through its 3-year+ price channel bottom down to the bottom of a long-term rising megaphone top (orange on chart above).
A tag here of the orange rising megaphone bottom would almost always mean the top is in for the move out of the 2009 low.
So the question is whether ES is going to 1.) turn Friday’s dip into a trip to the bottom of the blue 3-year+ price channel, and 2.) whether ES is going to make it through that price channel bottom before a new high to tag the bottom of the orange rising megaphone top.
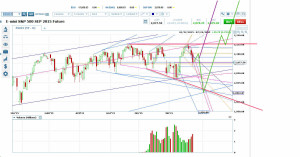
ES put in some weird moves around a new short-term price channel on Friday that strongly suggest ES is about to make a trip to the 3-year+ price channel bottom. That trip would usually mean an immediate retrace to roughly ES 2100, followed by a hard move down to roughly 2000 at the bottom of the ES 3-year+ price channel.
ES Flat-Topped Megaphone
The next question is whether the 3-year+ price channel bottom will stop the fall, and the chart contains a strong suggestion that it will. In addition to everything else, if ES completes a fast dip here to the bottom of the 3-year+ price channel, it will have drawn a flat-topped megaphone on its daily chart (Bulkowski calls this formation a right-angled and descending broadening formation).
These formations tend to be continuation patterns when they occur near a yearly high and reversal patterns when they occur near a yearly low. In other words, they tend to break out upwards. Bulkowski shows that formations that break out upwards reach their theoretical target 63% of the time. The theoretical target is essentially the length of the biggest wave down added to the formation top.
After this dip to the formation bottom, ES would usually put in one last small pullback from the formation top before a genuine breakout, essentially putting a larger inverse H&S on the chart as well.
Roughly 19% of these patterns fail on their upwards breakouts, meaning the price travels less than 5% and then reenters the formation. After a breakout failure, the drop tends to be huge.
What this all suggests is that ES is likely to be a good short from roughly 2100 to its 3-year+ price channel bottom, where it is likely to be a good long back to the top of the flat-topped megaphone. A pullback from there would be a dip to be bought.
The theoretical target on upwards breakout would be roughly ES 2250-2260. A breakout failure would be a set-up to short to the bottom of the orange rising megaphone.
Which stock should you buy in your very next trade?
With valuations skyrocketing in 2024, many investors are uneasy putting more money into stocks. Unsure where to invest next? Get access to our proven portfolios and discover high-potential opportunities.
In 2024 alone, ProPicks AI identified 2 stocks that surged over 150%, 4 additional stocks that leaped over 30%, and 3 more that climbed over 25%. That's an impressive track record.
With portfolios tailored for Dow stocks, S&P stocks, Tech stocks, and Mid Cap stocks, you can explore various wealth-building strategies.


