Trump announces trade deal with EU following months of negotiations
The question that everyone is asking right now about the single currency is ‘how low can it go’? To answer that we need look no further than the euro's daily and weekly charts.
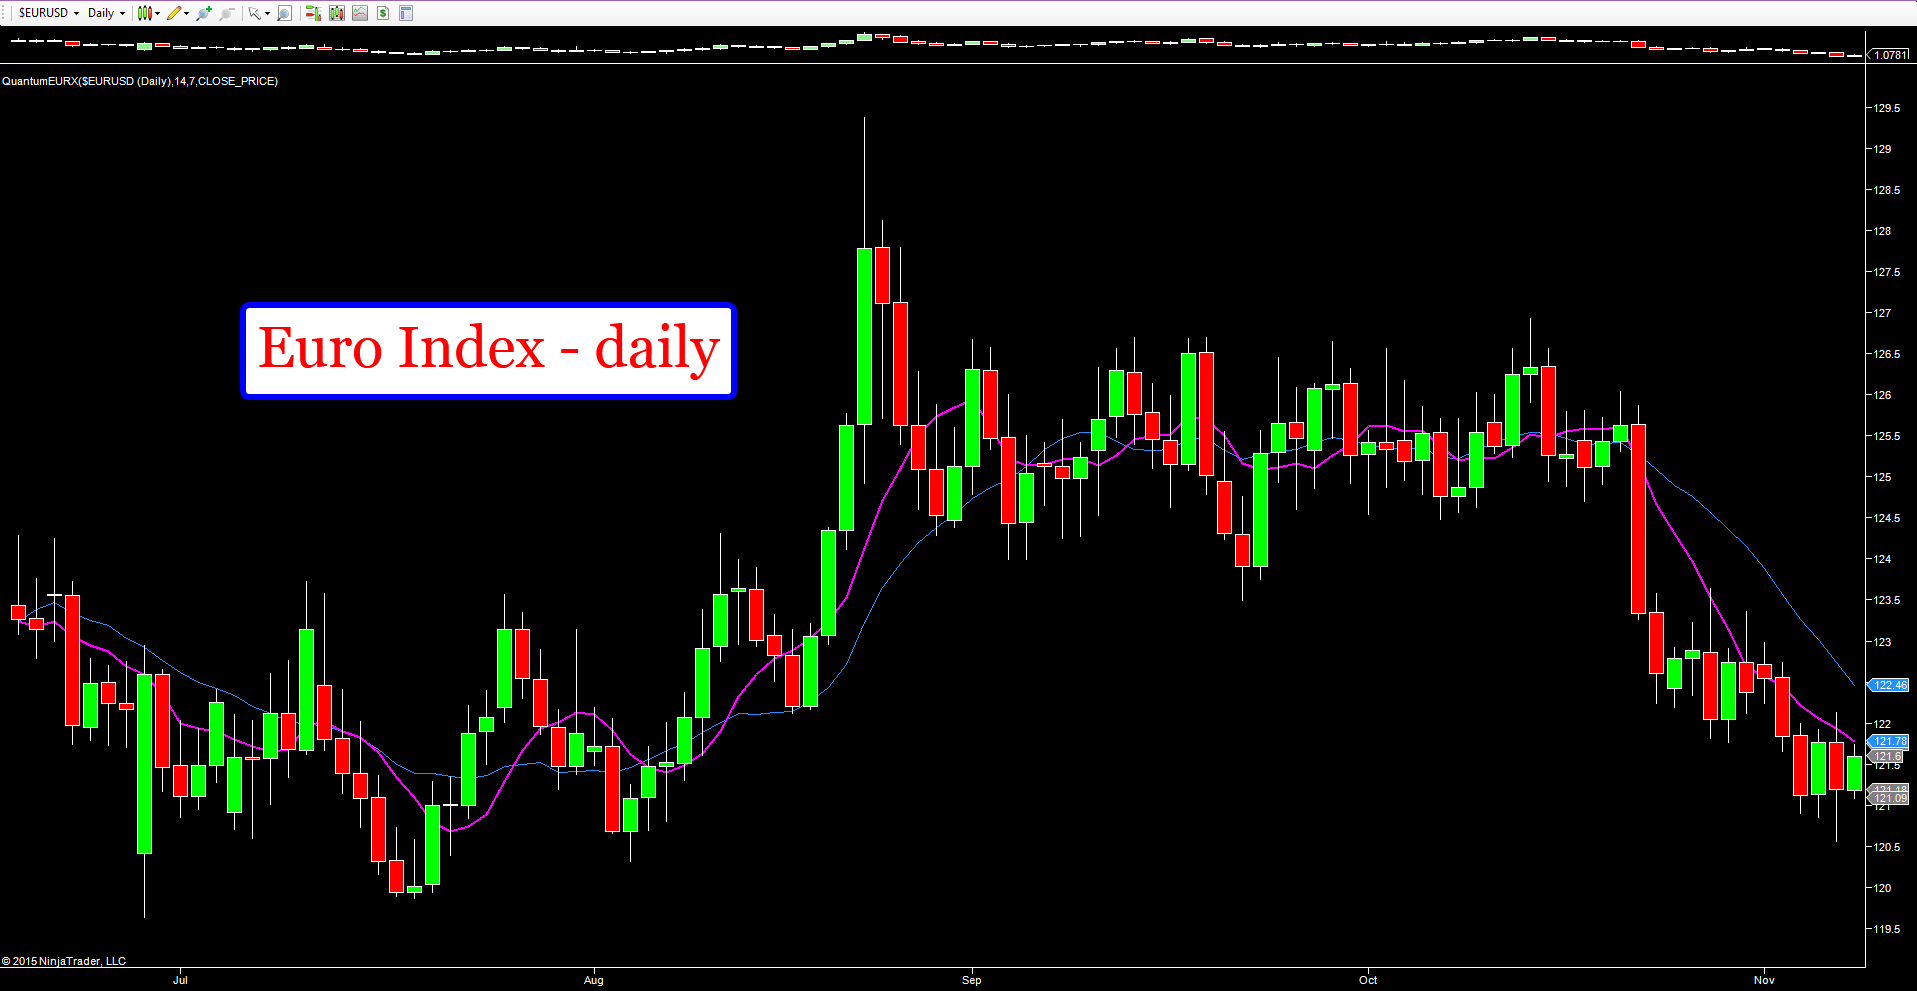
If we start with the daily chart, the longer-term congestion phase which saw the index trade in a narrow range during September and much of October between 126.70 to the upside and 124 to the downside was finally breached on the 22nd of October. The trigger was Mario Draghi’s hints of a further round of QE finally providing the catalyst for a breakaway from this region, with the index closing on a wide-spread down candle and well below the floor of support outlined above. This bearish sentiment for the euro was duly confirmed the next day, which was then followed by a short congestion phase with the index consolidating in the 122 to 123.50 area. During this phase of price action there were two strong signals of further weakness to come, as the candles from October 28 and October 30 closed with deep wicks to the upper bodies. Once again the current bearish sentiment has been confirmed with a deeper move to test the 121 area where a platform of potential support is now building. And with this morning’s modest rally largely as a result of intraday weakness in the US dollar, the index should achieve this price point in due course. Should the 121 area fail to hold then we can expect to see the index move lower to test the 119.50 area, which in turn will be reflected in further downside momentum particularly for the EUR/USD and the principle euro cross currency pairs.
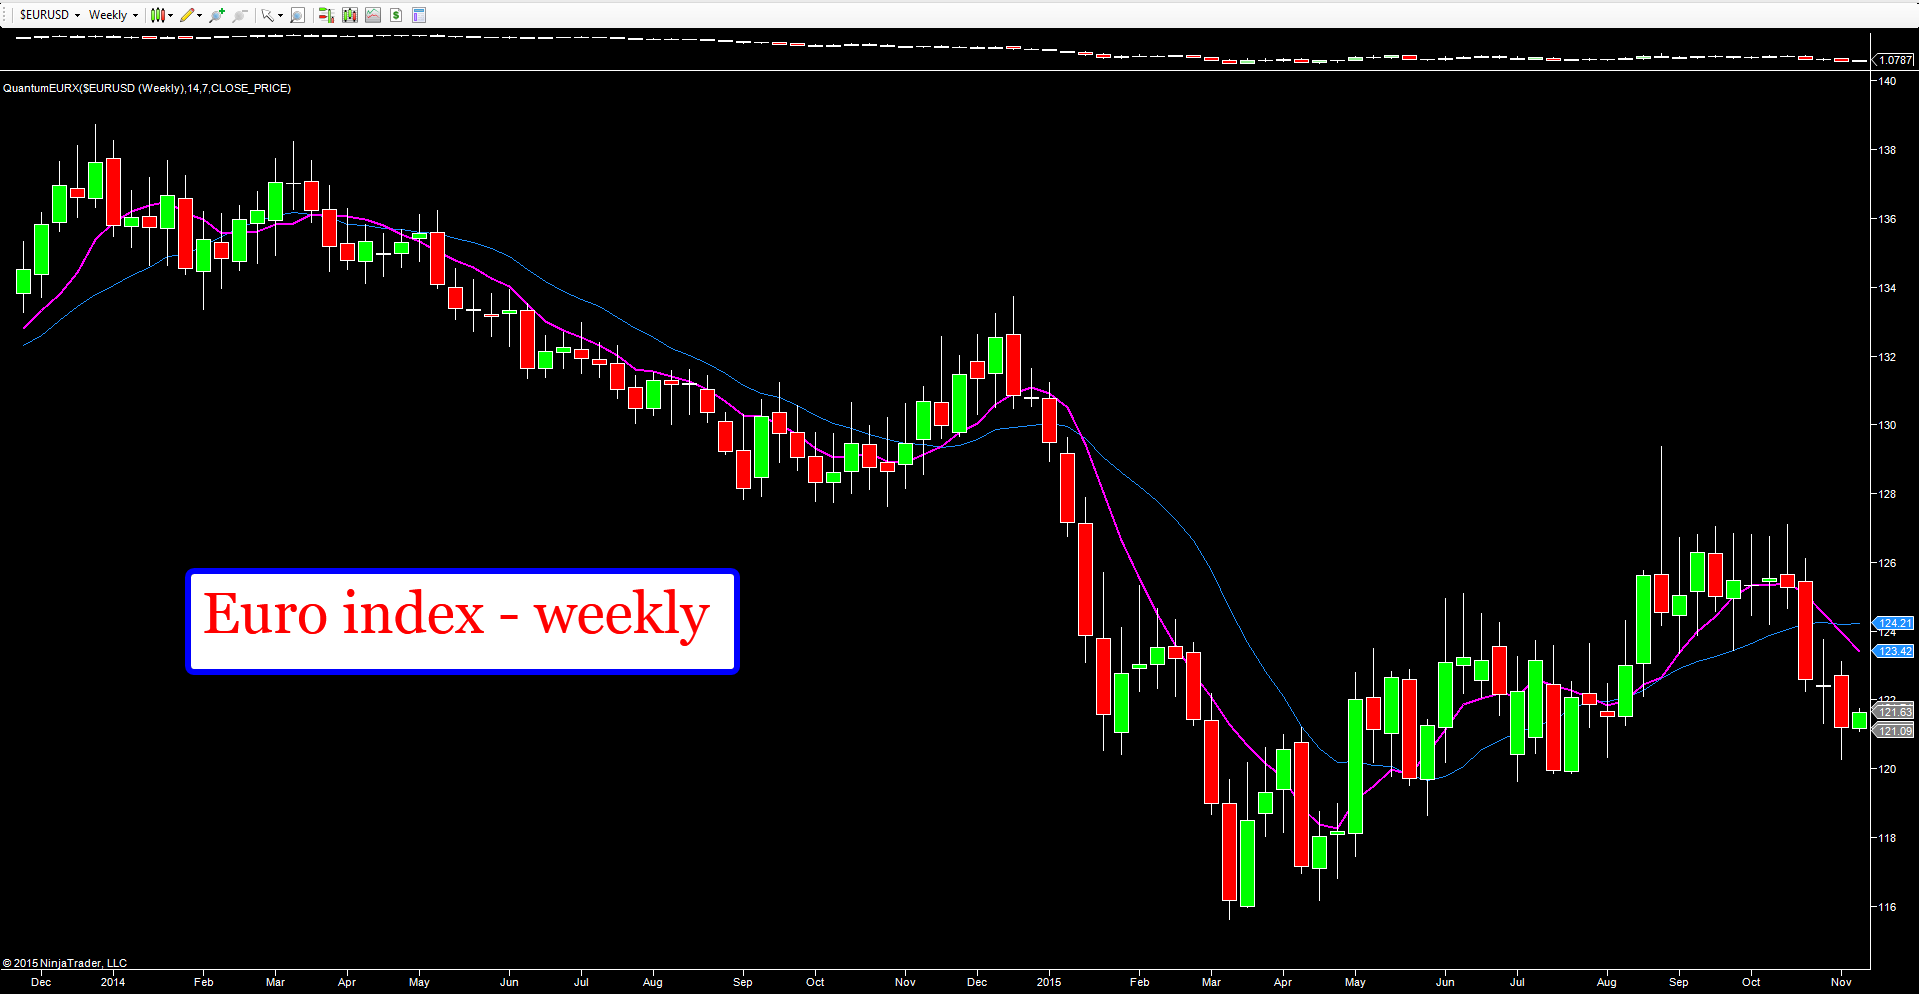
The weekly chart for the euro index confirms the current negative sentiment for the single currency, with last week’s price action moving the index firmly lower following the previous long-legged doji candle of indecision. Should the 119.50 area be breached, then the index could move lower still to test the 116 area in the longer term, last seen in March earlier in the year.
From a fundamental perspective there is speculation that the ECB is considering a deeper cut to the deposit rate at its December meeting. And with the FED now almost certain to raise interest rates, we can expect a lively end to the trading year.
Key eurodollar levels: 1.0707, which is last Friday’s low, and any break through here will see eurodollar on course to test the March 2015 support level in the 1.0460 region.
Charts from NinjaTrader and Euro index from Quantum Trading.
Which stock should you buy in your very next trade?
AI computing powers are changing the stock market. Investing.com's ProPicks AI includes 6 winning stock portfolios chosen by our advanced AI. In 2024 alone, ProPicks AI identified 2 stocks that surged over 150%, 4 additional stocks that leaped over 30%, and 3 more that climbed over 25%. Which stock will be the next to soar?
Unlock ProPicks AI


