
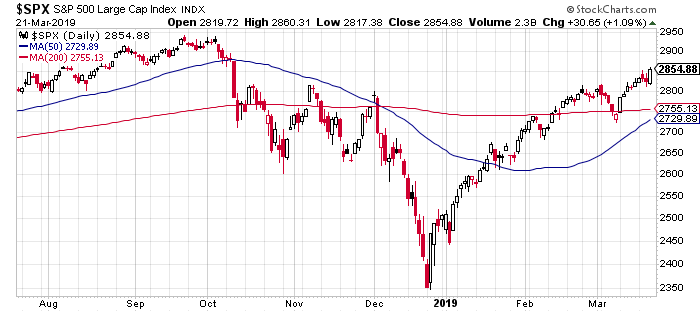
The sharp rebound in the U.S. stock market this year has cast doubts on various calls by models and pundits that a bear market started in the late-2018 plunge. But the rally hasn’t deterred bond manager Jeffrey Gundlach: the DoubleLine Capital CEO doubled down and told CNBC yesterday that the S&P 500 is still in a bear market despite closing on Thursday (Mar. 21) at the highest level since Oct. 9.
Gundlach’s outlook aligns with The Capital Spectator’s Hidden Markov model (HMM) analysis of late (see this update, for instance), which includes a fresh run of numbers through yesterday that reaffirms that the bear is still growling. The future is always uncertain, however, and so there can be no guarantee that real-time profiles for bull or bear are accurate.
While we’re waiting for Mr. Market to confirm (or reject) these bearish forecasts, let’s review how recent market action stacks up in history from the perspective of the previous drawdown and the current recovery that’s in progress.
What we do know is that the S&P 500’s rise so far this year has been impressive. The market’s up more than 21% since the Dec. 24 bottom. Yet despite the strong 2019 rally, the market is still below the previous peak that was reached last September. But another 2.6% rise over Thursday’s close would lift the S&P to its old high and so it’s not inconceivable that the market may soon throw recent bear market calls under the train.
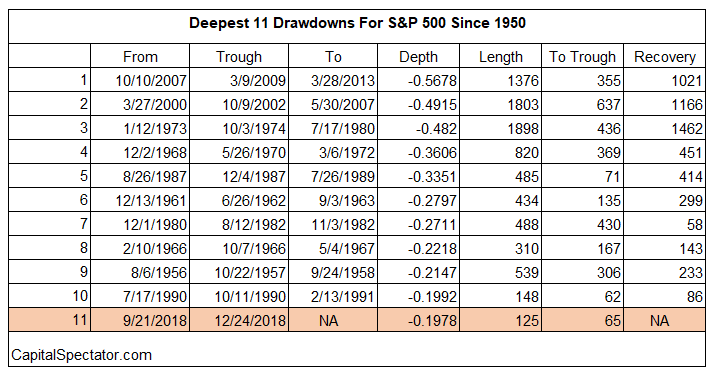
Meantime, let’s consider where the last drawdown fits in with history and then compare the current recovery with its predecessors. As the table below shows, the previous point of maximum drawdown – a 19.8% tumble as of Dec. 24, 2018 — was the S&P 500’s 11th deepest peak-to-trough decline since 1950 (shaded row at bottom of table).
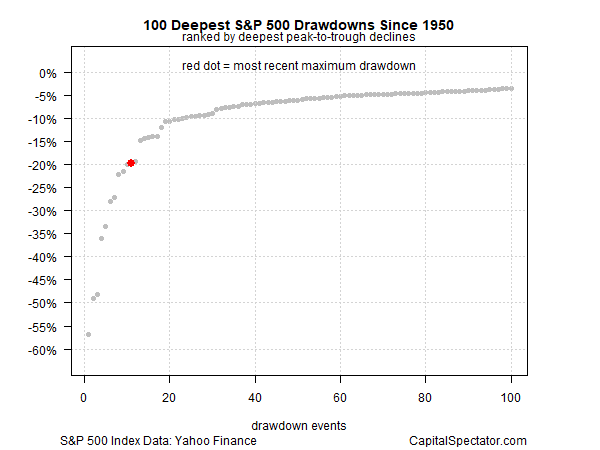
For a visual perspective, here’s a chart that plots the previous maximum drawdown (red dot) in context with the 100 deepest drawdowns since 1950. Although the roughly 20% slide through Dec. 24 was well short of the deepest declines, only a handful have been worse over the past 69 years.
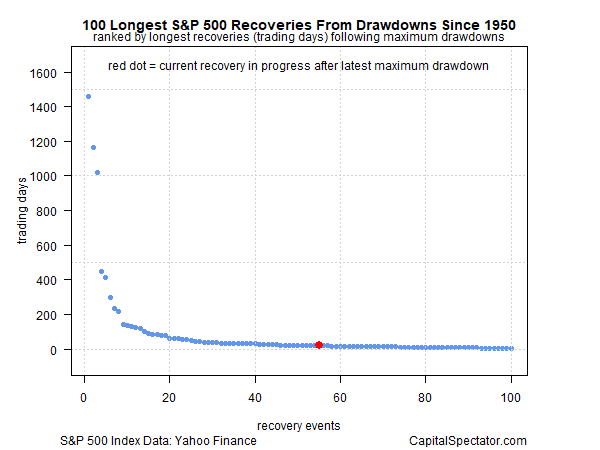
What’s interesting about the latest recovery is its speed. Although the market recently suffered one of its steepest drawdowns, the recovery (so far) has been comparatively quick. At the moment, the S&P 500’s recovery clocks in at rapid 59 trading days, which is a swift affair when you consider that the longest recovery since 1950 took a hefty 1,462 trading days (1974-1980). Although the market hasn’t fully recovered, it’s close. Assuming that stocks rally another 2.6% in the weeks ahead, the recovery will go into the history books as one of the faster revivals on record, and somewhat surprising given the depth of the previous drawdown.
That leaves us with the critical question: Are we in a bear-market rally or is the S&P on track to reach a new high in the near future? Only Mr. Market knows the answer and, per his usual routine, he’s not talking, at least not in a way that’s reliable and flawlessly clear to mere mortals.
Which stock should you buy in your very next trade?
AI computing powers are changing the stock market. Investing.com's ProPicks AI includes 6 winning stock portfolios chosen by our advanced AI. In 2024 alone, ProPicks AI identified 2 stocks that surged over 150%, 4 additional stocks that leaped over 30%, and 3 more that climbed over 25%. Which stock will be the next to soar?
Unlock ProPicks AI