We have mentioned that Gold is likely to test 1178 and 1156. Our reasons were clear enough technically and fundamentally. XAU/USD hit 1.160 USD and ended the week at 1.184.
Fundamentally:
Despite of the dramatic fall on XAU/USD, ETF’s Gold positions did not fall as much.The physical demand is coming back. Those are the good news for the Gold Bulls.
The move in Gold is really a function of Dollars strength.However, one of the main question is whether Gold is losing its safe have appeal? Some investors are wondering if the U.S. dollar is stealing gold’s safe-haven allure amid heightened trade tensions.
Technically:
Monthly Chart:
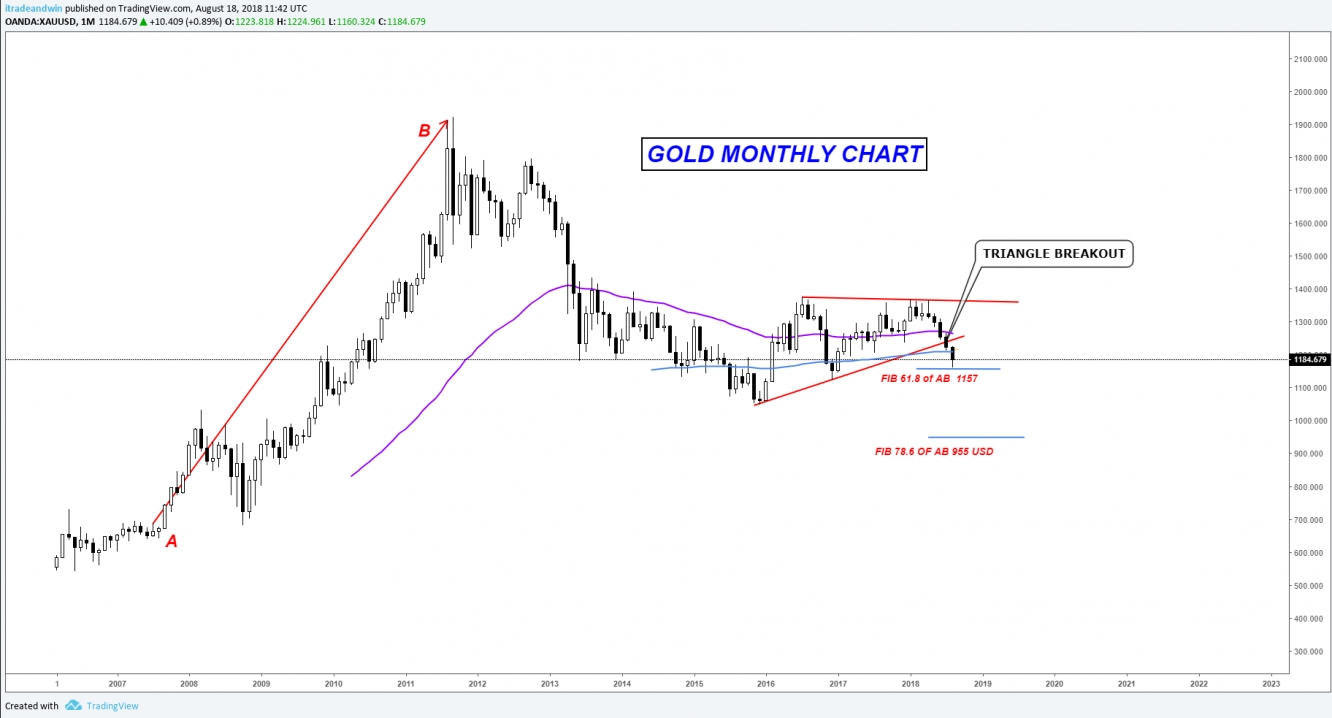
Gold Rally started in 2008. From 650 USD to 1900 USD. Gold Prices have been falling since 2012. Fibonacci 61.80 of XA move has been tested this week. ( 1157 – 1165 ). The question is: “ It was just a profit realisation or the bottom of the bearish move? “
If the Gold Prices breaks below Fibonacci 61.8, Fibonacci 78.6 is located at 950 USD.
As you will see on the chart, Gold broke out the triangle. Technically, it is not a good signal for the bulls.
Weekly Chart:
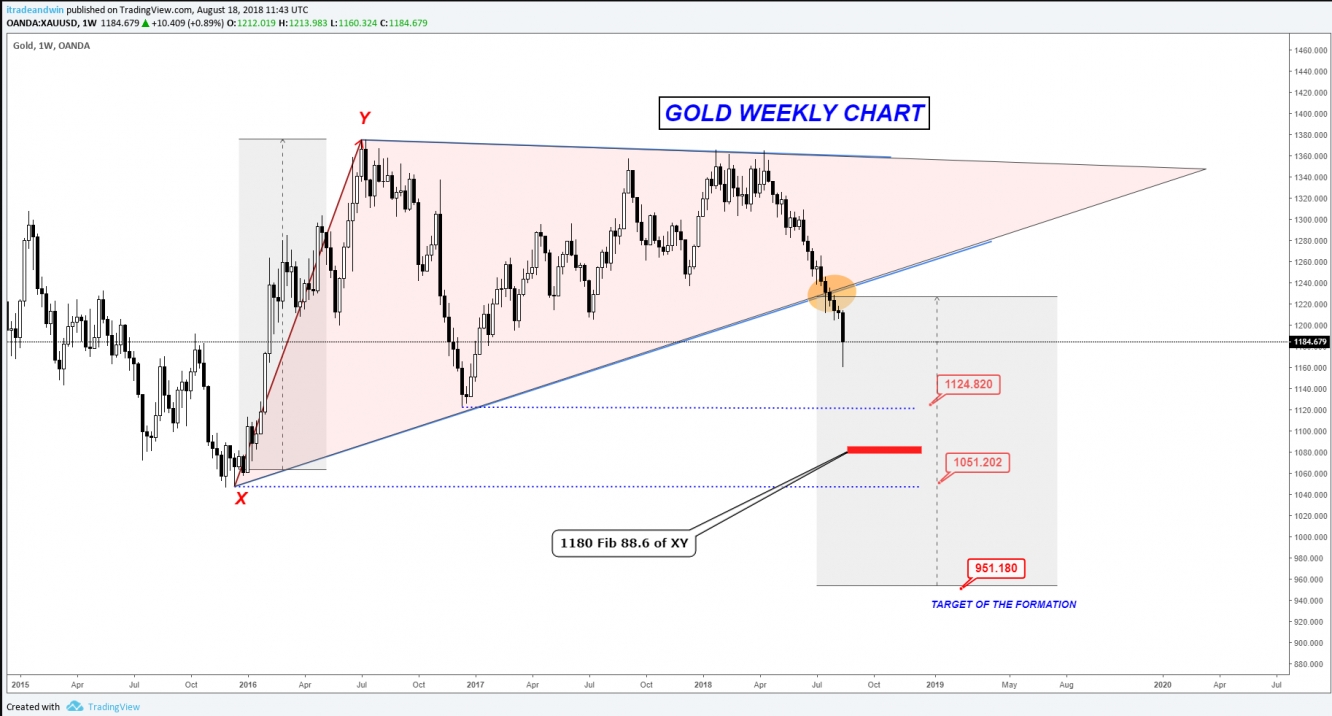
If we look at the broken triangle, on the downside, 1125 – Fibonacci 78.6 of XY - and 1050 are the next support levels. The target of the formation is 950 USD – 1.272 Extension of XY and 78.6 of AB on the monthly chart.
We have a sub-Fibonacci Level 88.6 at 1.080. This level is important in our Gold scenario.
Daily Chart:
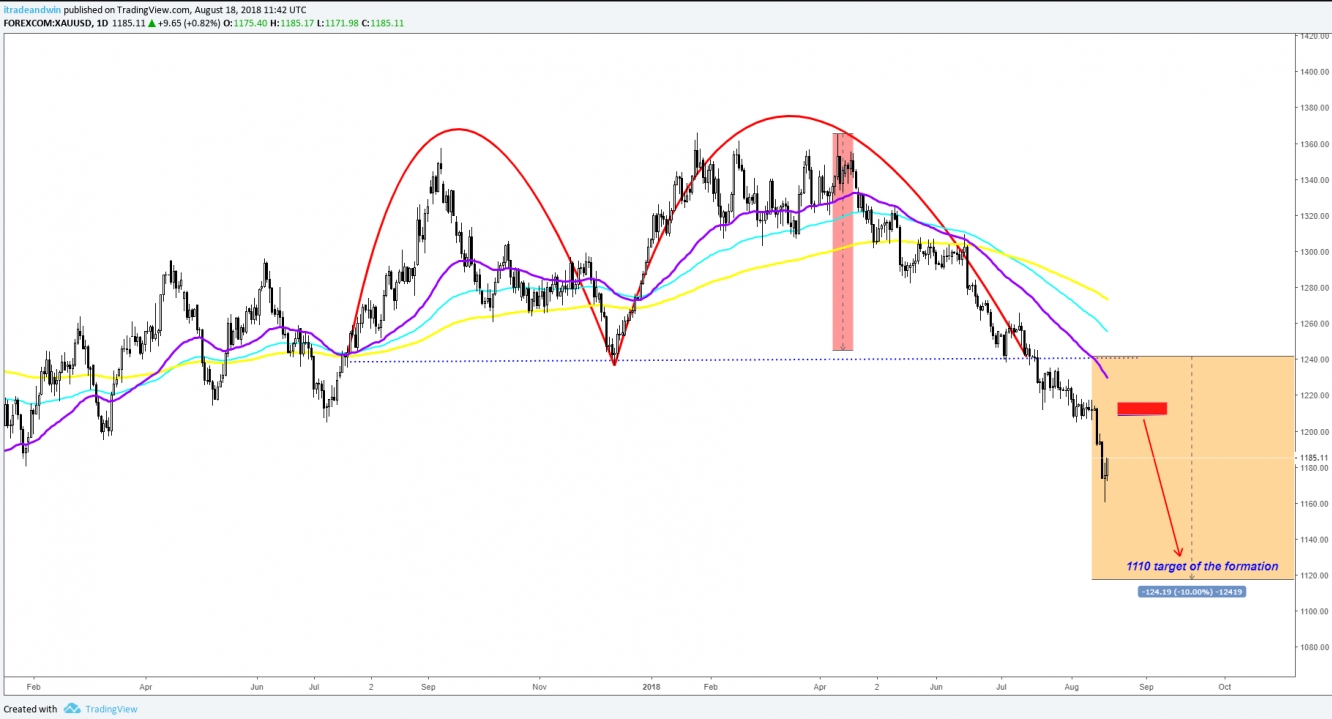
1360 has been tested several times. We see a double top and the neckline was 1240. Prices have dropped 60 USD after breaking below 1240. And the target of this formation is 1110 – 1120 levels.
Shorterm Overview:
Gold ended the week at 1.184 – above Fibonacci 61.80 – We may see a correction towards 1.190 and 1.208 USD.
We have 2 bearish patterns confirming the bearish continuation.
Conclusion:
1. We do not predict the Gold prices will turn into a Bullish trend as long as the prices hold below 1.240. – Not before the second half of 2019 -
2. All pullbacks towards 1218 are selling opportunities. – Shortterm selling levels will be published for the members –
3. Breakout of Fib 61.8 – 1157-1160 – will carry the prices 1124 and 1100 .
4. There is a sub region between 1.100 and 1.080 where we can see a strong bullish reaction towards 1210 USD. ( Stop Hunt of the new sellers )
5. This scenario is valid under the current fundamental facts. A dramatic change on the fundamentals would invalidate this scenario.
This analysis prepared by the global analysts of Chartreaderpro.com and published on Investing.com. Commercial distribution is strictly prohibited.
Which stock should you buy in your very next trade?
AI computing powers are changing the stock market. Investing.com's ProPicks AI includes 6 winning stock portfolios chosen by our advanced AI. In 2024 alone, ProPicks AI identified 2 stocks that surged over 150%, 4 additional stocks that leaped over 30%, and 3 more that climbed over 25%. Which stock will be the next to soar?
Unlock ProPicks AI


