On Thursday, the Department of Labor announced that initial jobless claims dropped. Quite a lot. So naturally, markets reacted. The stock market began to rise. The euro rose, at least for a while.
And the prices of our favorite heavy metals rose, particularly silver, which was near its low of $16.92 before the report. Two and a half hours later, it was at $17.26. Our first reaction was to ask, “really? Unemployment causes silver buying?”
OK, sure, we suppose if everyone is maximally employed, they will buy more jewelry, electronics, solar panels and all of the consumer products that contain silver. Or, perhaps they will buy silver coins and stack them.
However, a 2 percent increase in just over 2 hours seems overdone. So we turned to the data to take a look. We have described the basis theory many times. Today, let’s just say it simply: If speculators are buying, they want leverage and they tend to use futures. If there is real demand for real silver, these businesses and stackers buy real metal.
These are two different markets, with two different prices.
So we want to look to see the change in the futures price, not relative to where it was but relative to the spot price. We know how much it changed over 150 minutes: 34 cents. We want to look at how much it changed relative to the price of real metal.
This difference between future price and metal price is called the basis. If the basis increased, it means that the price action was driven in the futures market. If a speculator bids up the price of a silver futures contract, then the basis goes up.
A market maker will pull up the price of spot silver—you will not see the price of the futures just divorce itself from spot. But spot is pulled up reluctantly, dragging behind.
Our data platform has the resolution to show these moves in high resolution.
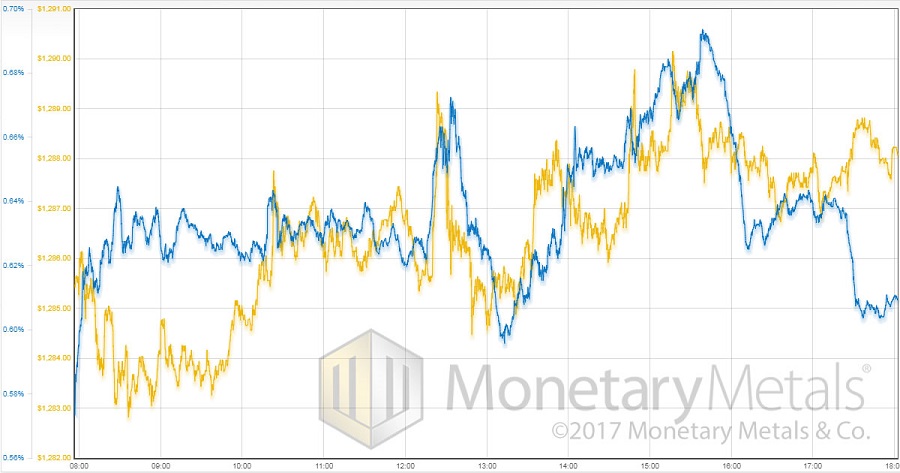
Here is the intraday graph, showing the gold price and gold basis (December contract) before, during and after the move.

The move in gold was about $6. Yet we can clearly see there is a pretty good correlation between basis and price. The conclusion: speculators saw the news item, decided gold should go up, and they made it happen. They front-run what they theorize ought to happen. But the fundamental demand is not there. Perhaps one of these days, they will be right and demand for metal will increase sharply after the speculators buy in. But we suspect that today is not that day.
Note that the basis shows a rise at the very start of the graph and goes high until after 10am (GMT) when the correlation with price clicks into place. We place less weight on the drop in basis at the the trading day, which is when spreads tend to do funny things.
The percentage move in silver was about four times bigger.
