5 big analyst AI moves: Amazon PT hike, Apple lagging in GenAI race

The Bureau of Labor Statistics released the latest CPI data this morning. Year-over-year unadjusted Headline CPI came in at 1.96%, which the BLS rounds to 2.0%, up from 1.75% last month (rounded to 1.4%). Year-over-year Core CPI (ex Food and Energy) came in at 1.70%, up from last month's 1.64% (rounded to 1.6%).
Here is the introduction from the BLS summary, which leads with the seasonally adjusted data monthly data:
The Consumer Price Index for All Urban Consumers (CPI-U) increased 0.2 percent in July on a seasonally adjusted basis, the U.S. Bureau of Labor Statistics reported today. Over the last 12 months, the all items index increased 2.0 percent before seasonal adjustment.
The rise in the seasonally adjusted all items index was the result of increases in a broad array of indexes including shelter, gasoline, apparel, and food. Despite the gasoline increase, the energy index rose only 0.2 percent as the natural gas and electricity indexes declined. The increase in the food index was caused by a sharp rise in the fruits and vegetables index; other food indexes were mixed.
The index for all items less food and energy rose 0.2 percent in July, the third straight such increase. Along with the advances in the shelter and apparel indexes, the indexes for medical care, tobacco, and new vehicles all rose. In contrast, the indexes for household furnishings and operations, airline fares, and used cars and trucks all declined in July.
The all items index increased 2.0 percent over the last 12 months. The index for all items less food and energy has risen 1.7 percent over the last year; this compares to 1.6 percent for the 12 months ending June. The energy index has risen 4.7 percent over the last 12 months, its largest increase since the 12 months ending February 2012. The food index has risen 1.4 percent, the same figure as in May and June. More...
The Investing.com consensus forecast was for a 0.2% MoM for both Headline and Core. Their YoY forecasts were spot-on at 2.0% for Headline and 1.7% for Core.
The first chart is an overlay of Headline CPI and Core CPI (the latter excludes Food and Energy) since 1957. The second chart gives a close-up of the two since 2000. 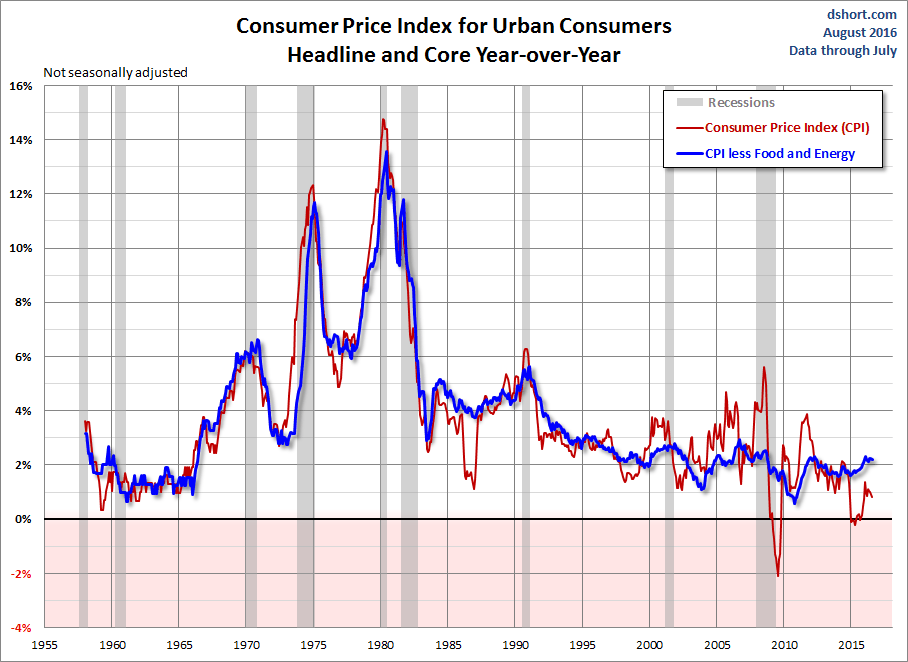
On the chart below I've highlighted 2 to 2.5 percent range. Two percent has generally been understood to be the Fed's target for core inflation. However, the December 12 FOMC meeting raised the inflation ceiling to 2.5% for the next year or two while their accommodative measures (low Fed Funds Rate and quantitative easing) are in place.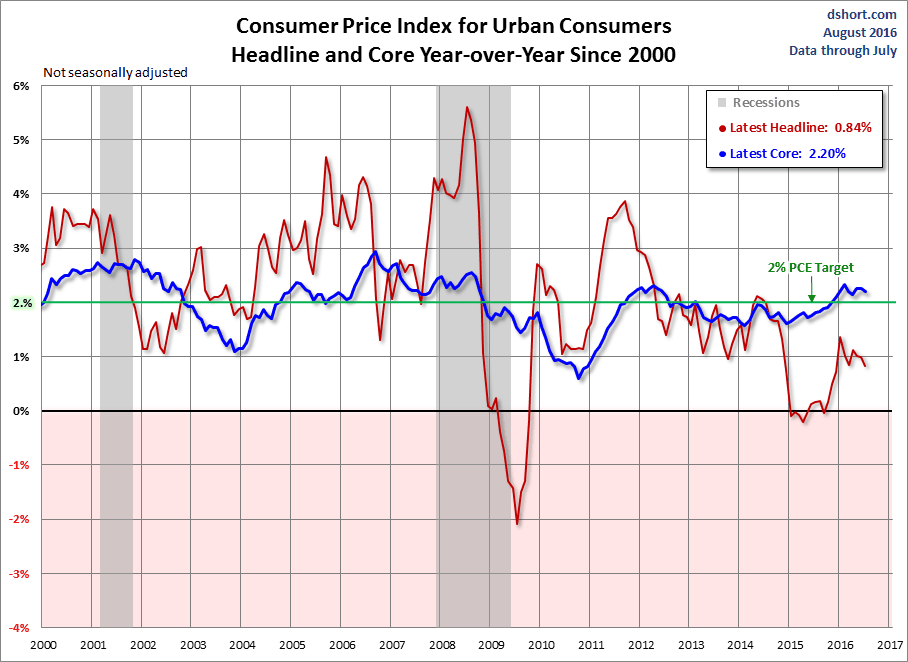
Federal Reserve policy, which has historically focused on core inflation, and especially the core Personal Consumption Expenditures (PCE), will see that the latest core CPI is below the near-term target range of 2 to 2.5 percent, and the more volatile headline inflation, is well below the target range.
3rd party Ad. Not an offer or recommendation by Investing.com. See disclosure here or remove ads.
Which stock should you buy in your very next trade?
With valuations skyrocketing in 2024, many investors are uneasy putting more money into stocks. Unsure where to invest next? Get access to our proven portfolios and discover high-potential opportunities.
In 2024 alone, ProPicks AI identified 2 stocks that surged over 150%, 4 additional stocks that leaped over 30%, and 3 more that climbed over 25%. That's an impressive track record.
With portfolios tailored for Dow stocks, S&P stocks, Tech stocks, and Mid Cap stocks, you can explore various wealth-building strategies.