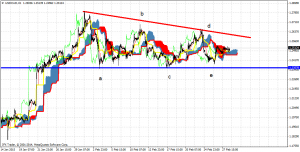
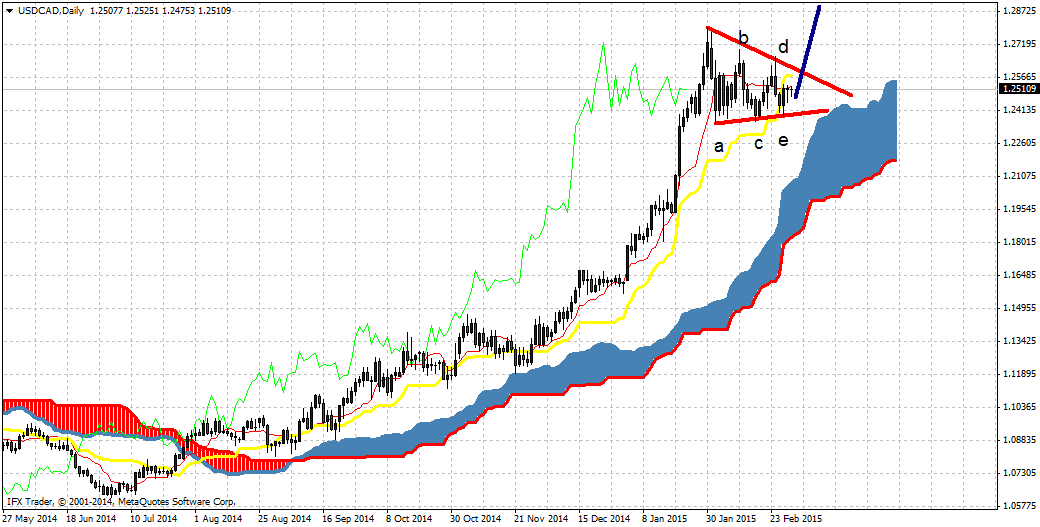
The sideways consolidation in USD/CAD could very well be over as there are 5 waves (a-b-c-d-e) in the sideways move we are witnessing for the last month. The triangle pattern is a typical corrective pattern after such a big rally from 1.13. The upper triangle pattern boundaries are found at 1.2610 while the lower boundaries are at 1.2390.
Followers have seen my trade and have gone long this pair since 1.2426 when we were at the final stages of wave e down. My projection now sees we could reach 1.29-1.30 once we break above the triangle resistance at 1.2610.

Which stock should you buy in your very next trade?
With valuations skyrocketing in 2024, many investors are uneasy putting more money into stocks. Unsure where to invest next? Get access to our proven portfolios and discover high-potential opportunities.
In 2024 alone, ProPicks AI identified 2 stocks that surged over 150%, 4 additional stocks that leaped over 30%, and 3 more that climbed over 25%. That's an impressive track record.
With portfolios tailored for Dow stocks, S&P stocks, Tech stocks, and Mid Cap stocks, you can explore various wealth-building strategies.

