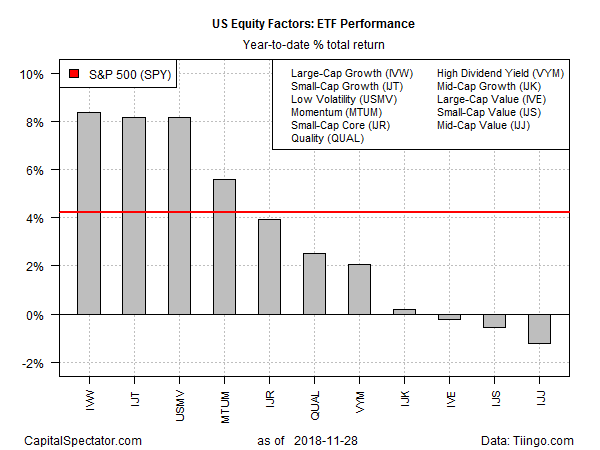
Despite a turbulent run for the US stock market over the past two months, the growth factor’s edge is intact by a solid margin relative to value, based on a set of ETFs. Although year-to-date equity returns generally have been trimmed recently, the growth-value divide remains stark, with the former still posting a healthy gain in 2018 while the latter has deteriorated to a slight loss.
Large-cap growth remains in first place by a nose for year-to-date performance through yesterday’s close (Nov. 28). The iShares S&P 500 Growth (IVW) is up a solid 8.4% so far in 2018. Second place for this year is currently split between iShares S&P Small-Cap 600 Growth (IJT) and iShares Edge MSCI Minimum Volatility USA (USMV) – each fund is ahead by 8.2%.
On the flip side, three value-factor ETFs have slipped into the red for year-to-date results, posting mildly negative returns for the small-, mid- and large-cap buckets. The iShares S&P Mid-Cap 400 Value ETF (IJJ), a mid-cap portfolio, suffers the deepest setback, falling 1.2% so far in 2018.
Interested In Learning R For Portfolio Analysis?
By James Picerno
Whatever’s driving value stocks down this year, no one can blame a broad definition of equity beta. The SPDR S&P 500 (NYSE:SPY), a widely followed benchmark of US equities, is up 4.2% year to date.

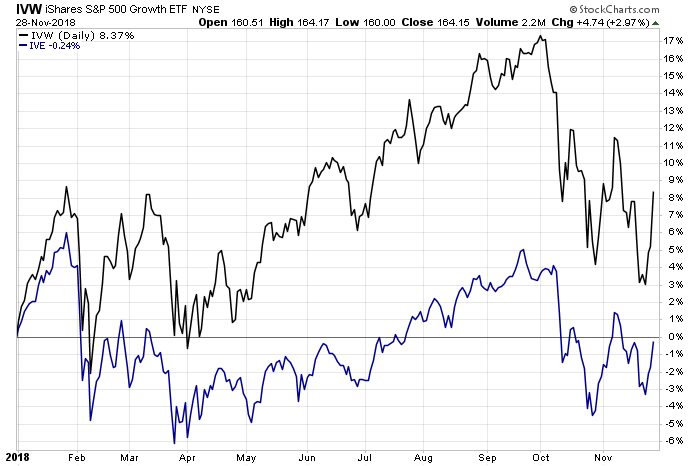
Some investors have been encouraged by value’s modestly firmer performance over the past month relative to growth. Is that a sign that a leadership transition is underway? Perhaps, but it could easily be noise. Indeed, the year-to-date profile at the moment still favors growth by a substantial degree. As the chart below suggests, the upside momentum in large-cap growth stocks (IVW), for instance, remains considerable vs. its value counterpart (IVE).

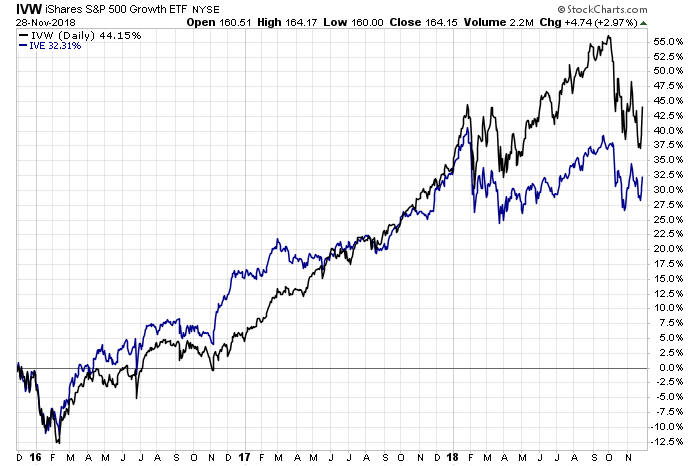
Growth’s sizable edge in the large-cap space holds up for the trailing three-year period, too.

The growth factor’s performance leadership won’t last forever, but for the moment it’s not yet obvious that a sustainable renaissance in value has arrived
Disclosure: Originally published at Saxo Bank TradingFloor.com
Which stock should you buy in your very next trade?
AI computing powers are changing the stock market. Investing.com's ProPicks AI includes 6 winning stock portfolios chosen by our advanced AI. In 2024 alone, ProPicks AI identified 2 stocks that surged over 150%, 4 additional stocks that leaped over 30%, and 3 more that climbed over 25%. Which stock will be the next to soar?
Unlock ProPicks AI