Get 40% Off
🚨 Volatile Markets? Find Hidden Gems for Serious OutperformanceFind Stocks Now

Gold’s Sudden, Newfound Relative Strength

Published 08/20/2017, 01:21 AM
Updated 07/09/2023, 06:31 AM

Three weeks ago we discussed how Gold needed to perform considering the US$ index was likely to bounce due to an oversold condition and extreme bearish sentiment.

We wrote: “Simply put, Gold will have to prove itself in real terms if it is going to hold its ground or breakout as the US$ begins a likely bounce.”

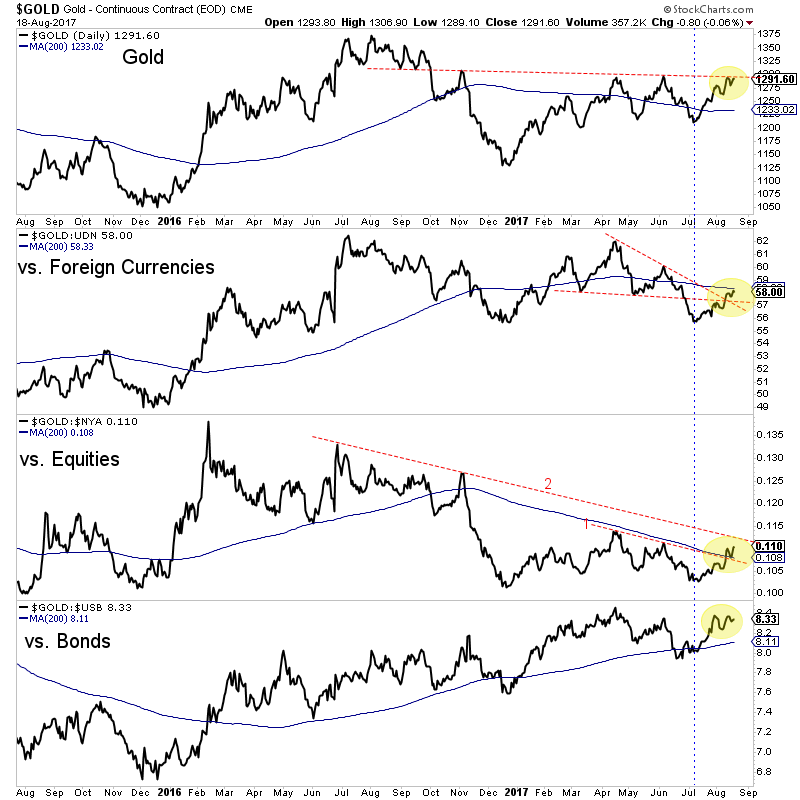
The US$ index has enjoyed only a slight rebound but Gold has maintained its 2017 US$ weakness induced gains because of its strong relative performance. Below we plot the daily line chart of Gold and a number of ratios: Gold against foreign currencies (Gold/FC), Gold against Equities and Gold against Bonds. Since the July low, Gold has showed good nominal and relative performance.

Gold Daily Chart

The key has been the strong rebound in Gold/FC and the breakout in Gold/Equities. Gold/FC has broken above two trendlines and is now testing its 200-day moving average. Meanwhile, Gold/Equities has broken above one trendline and has regained its 200-day moving average. It would be very bullish for Gold if Gold/FC pushed through its 200-day moving average while Gold/Equities pushed above trendline 2. Those moves would likely accompany a Gold breakout through $1300/oz but more importantly, they would put Gold in a position of trading above its 200-day moving average in nominal terms and against the major asset classes (stocks, bonds, currencies).

Although Gold failed to break above $1300/oz today (Friday), it remains in position to do so because of its renewed strength in real terms. As long as the US$ index does not rally hard, we expect Gold to break above $1300 and reach $1375. The gold stocks as a group have been lagging recently but in the event of a Gold breakout, we foresee significant upside potential as the group could play catch up.

3rd party Ad. Not an offer or recommendation by Investing.com. See disclosure here or remove ads .

Latest comments

Risk Disclosure: Trading in financial instruments and/or cryptocurrencies involves high risks including the risk of losing some, or all, of your investment amount, and may not be suitable for all investors. Prices of cryptocurrencies are extremely volatile and may be affected by external factors such as financial, regulatory or political events. Trading on margin increases the financial risks.
Before deciding to trade in financial instrument or cryptocurrencies you should be fully informed of the risks and costs associated with trading the financial markets, carefully consider your investment objectives, level of experience, and risk appetite, and seek professional advice where needed.
Fusion Media would like to remind you that the data contained in this website is not necessarily real-time nor accurate. The data and prices on the website are not necessarily provided by any market or exchange, but may be provided by market makers, and so prices may not be accurate and may differ from the actual price at any given market, meaning prices are indicative and not appropriate for trading purposes. Fusion Media and any provider of the data contained in this website will not accept liability for any loss or damage as a result of your trading, or your reliance on the information contained within this website.
It is prohibited to use, store, reproduce, display, modify, transmit or distribute the data contained in this website without the explicit prior written permission of Fusion Media and/or the data provider. All intellectual property rights are reserved by the providers and/or the exchange providing the data contained in this website.
Fusion Media may be compensated by the advertisers that appear on the website, based on your interaction with the advertisements or advertisers.
© 2007-2024 - Fusion Media Limited. All Rights Reserved.