TSMC Q2 profit soars 61% to record high; sees AI demand offsetting forex headwinds
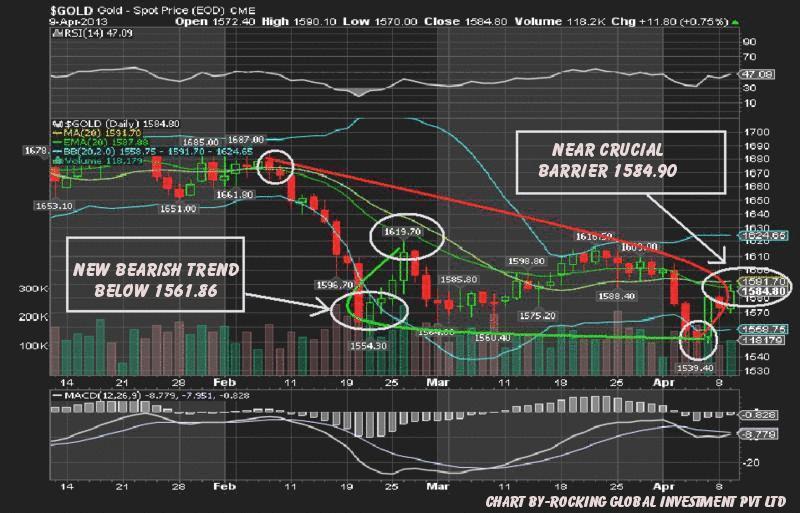
Gold is near intra-day low 1570 with reduction 0.98% on the U.S. morning trading session. Gold prices extended losses on Wednesday after an early release of the FOMC's March minutes showed clear divisions over how long the central bank's stimulus program should continue. Gold for May delivery was down $18.15 ahead of the report, which stretched that to a loss of $10.60, or 0.7%, to $1,570.70 an ounce.
Sentiment for gold was already dented and our readers knows that we have given short sell recommendation at 1584 with SL 1590.94 for target, 1561.86 today low 1567.65. Yesterday gold created high 1590.44 but our SL 1590.94 never hit.
Goldman's Bearish Outlook
U.S. investment bank Goldman Sachs (GS) today issued a report on gold investing, advising clients to sell the metal short on the futures market. Goldman also advise opening a short position on the Comex gold futures exchange, with a price target of $1450 per ounce and a stop-loss -- in case the trade goes wrong and prices actually rise -- at $1650. The firm also cut its three, six and 12-month price forecasts, with April 2014 now cut at $1390 from $1550. Major bullion dealer Deutsche Bank (DB), yesterday, cut its average 2013 price forecast by 12% to $1637 per ounce. Fellow London market maker UBS (UBS), meantime, cut its average 2013 price forecast from $1900 to $1740 per ounce.

On Tuesday, gold did not sustain its crucial resistance and 20-day SMA 1591.70 with a weak close below its 20-day EMA at 1587.88. We've already cleared the two-day bullish trend today and prices are trading below 1570. On the quarterly chart, U.S. gold creates a symmetrical triangle in and in a down trend gives a signal that a fresh bearish trend can start below its near-crucial main support at 1561.84.
You can see more downside level below 1547.26 if gold breaks its crucial support of 1561.86. Short-term traders make fresh bearish trend below 1561.86. Gold's upper Bollinger Band® may start above 1591.70 on the three-month chart. Short-term traders sell around 1577.79 with strict SL 1584.90 for a target 1561.86 and 1555.33.
Short-Term Traders Should Follow These Levels:
- Support – 1561.86 – 1555.33 – 1547.26
- Resistance – 1584.90 – 1591.70 – 1601.11
Which stock should you buy in your very next trade?
AI computing powers are changing the stock market. Investing.com's ProPicks AI includes 6 winning stock portfolios chosen by our advanced AI. In 2024 alone, ProPicks AI identified 2 stocks that surged over 150%, 4 additional stocks that leaped over 30%, and 3 more that climbed over 25%. Which stock will be the next to soar?
Unlock ProPicks AI