Nvidia shares jump after resuming H20 sales in China, announcing new processor
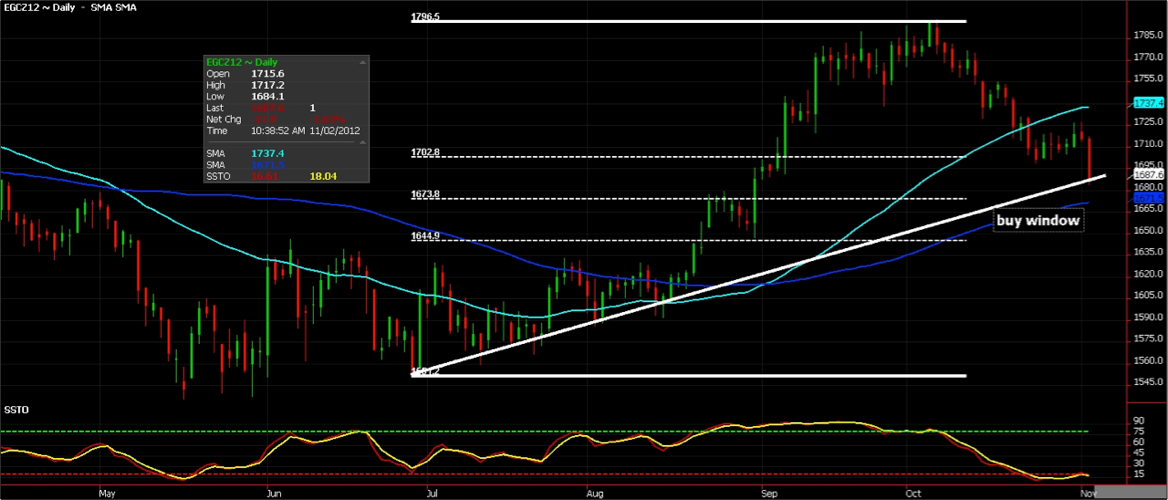
The trend line mentioned for weeks identified but the white up-sloping line is in play. As of this post gold is down 1.75% quickly approaching the 100-day MA; the blue line currently at $1671. My buy window would be between the 61.8% Fibonacci level and the 50% Fibonacci level which is about a $30 gap. My suggestion is to start nibbling and look to add to the trade when the market proves you correct.
This is a chart of December future so the price might be a little off because I would suggest going out to February, which gives you approximately three months. Those looking for more time can go out to April or June contracts. I like the idea of bull call spreads and have started to price these out for clients in both gold and silver. Those braver traders could look to start scaling into futures. Just remember if the 61.8% Fib level gives way I do not see stiff support until $1600/ounce so factor that in when sizing your positions.
3rd party Ad. Not an offer or recommendation by Investing.com. See disclosure here or remove ads.
Which stock should you buy in your very next trade?
AI computing powers are changing the stock market. Investing.com's ProPicks AI includes 6 winning stock portfolios chosen by our advanced AI. In 2024 alone, ProPicks AI identified 2 stocks that surged over 150%, 4 additional stocks that leaped over 30%, and 3 more that climbed over 25%. Which stock will be the next to soar?
Unlock ProPicks AI