Bitcoin price today: slips to $117k from record peak; US inflation awaited
Gold for Tuesday, October 14, 2014
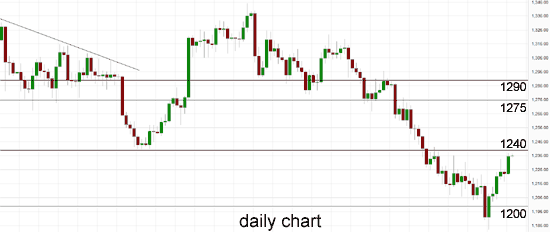
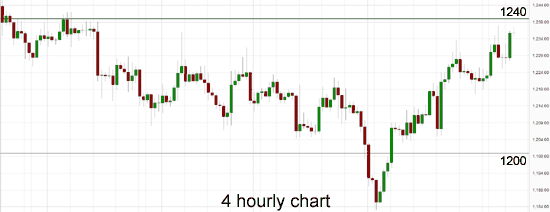
For the last few weeks gold has enjoyed solid support at $1215 after falling strongly a couple of weeks ago from $1240 to just below $1215, however a couple of weeks ago it dropped to its lowest level in 2014 near $1180. In the last week or so since however gold has rallied higher and returned to back above $1230 again to be within reach of a previous key level at $1240. Should gold retrace again, the next obvious level of potential support remains at $1200 which is a long term key level. Several weeks ago gold was enjoying a resurgence as it moved strongly higher off the support level at $1275, however it then ran into resistance at $1290. In the week prior, gold had been falling lower back towards the medium term support level at $1290 however to finish out last week it fell sharply down to the previous key level at $1275. Over the last month or so the $1290 level has shown some signs of support and held gold up until its recent sharp decline. During the second half of June, gold steadily moved higher but showed numerous incidents of indecision with its multiple doji candlestick patterns on the daily chart. This happened around $1320 and $1330.
The OANDA long position ratio for gold has moved back up to 65% as gold has rallied back above $1230. At the beginning of June, gold did very well to repair some damage and return to the key $1275 level, then it has continued the momentum pushing a higher to its recent four month high. After moving so little for an extended period, gold dropped sharply back in May from above the well established support level at $1275 as it completely shattered this level falling to a four month low around $1240. It remained around support at $1240 for several days before its strong rally higher. It pushed down towards $1280 before sling shotting back and also had an excursion above $1300 for a short period before moving quickly back to the $1293 area again. Over the last few weeks gold has eased back from around $1315 to establish its recent narrow trading range below $1295 before its recent slump.
Way back since March, the $1275 level has established itself as a level of support and on several occasions has propped up the price of gold after reasonable falls. Throughout the second half of March gold fell heavily from resistance around $1400 back down to a several week low near support at $1275. Both these levels are now distant memories however may play another role should gold move up higher. Through the first couple of months of this year, gold moved very well from a longer term support level around $1200 up towards a six month higher near $1400 before returning to its present trading levels closer to $1200.
Gold settled higher on Monday as the dollar fell on uncertainty about global economic growth, while the prospect of more economic stimulus from China also increased bullion’s investment appeal. Gold was on track for its fifth rise in the past six sessions after the dollar index fell on growth concerns and worries that the Federal Reserve may wait longer to hike U.S. interest rates. Last week, the greenback notched its biggest weekly loss in six months. Also underpinning gold was Chinese economic data suggesting the economy likely grew in the third quarter at its weakest pace in more than five years. This had some investors speculating that Beijing may roll out more stimulus measures. Gold got a boost from a strong rebound in Chinese imports of industrial commodities in September. But some market watchers said bullion looks vulnerable to further losses on an improving U.S. economic outlook. Last week, the metal tumbled to a 15-month low of $1,183.46, near a four-year low, following strong U.S. jobs data for September.
Gold October 14 at 01:00 GMT 1235.1 H: 1237.5 L: 1234.9
Gold Technical
| S3 | S2 | S1 | R1 | R2 | R3 |
| 1200 | — | — | 1240 | 1290 | — |
During the early hours of the Asian trading session on Tuesday, Gold is surging higher back to near $1240 after finishing last week consolidating just under $1225. Current range: trading right around $1235.
Further levels in both directions:
• Below: 1200.
• Above: 1240 and 1290.
OANDA’s Open Position Ratios
![]()
(Shows the ratio of long vs. short positions held for gold among all OANDA clients. The left percentage (blue) shows long positions; the right percentage (orange) shows short positions.)
The long position ratio for gold has moved back to 65% as gold has rallied back above $1230. The trader sentiment is strongly in favour of long positions.
Economic Releases
- 23:30 (Mon) AU Westpac Consumer Confidence (Oct)
- 00:30 AU NAB Business Conditions & Confidence (Sep)
- 08:30 UK CPI (Sep)
- 08:30 UK Input & Output Prices (unadj.) (Sep)
- 08:30 UK ONS House Prices (Aug)
- 09:00 EU ZEW (Economic Sentiment) (Oct)
- 09:00 EU Industrial production (Aug)
- WLD IEA Monthly Oil Market Report
Which stock should you buy in your very next trade?
With valuations skyrocketing in 2024, many investors are uneasy putting more money into stocks. Unsure where to invest next? Get access to our proven portfolios and discover high-potential opportunities.
In 2024 alone, ProPicks AI identified 2 stocks that surged over 150%, 4 additional stocks that leaped over 30%, and 3 more that climbed over 25%. That's an impressive track record.
With portfolios tailored for Dow stocks, S&P stocks, Tech stocks, and Mid Cap stocks, you can explore various wealth-building strategies.


