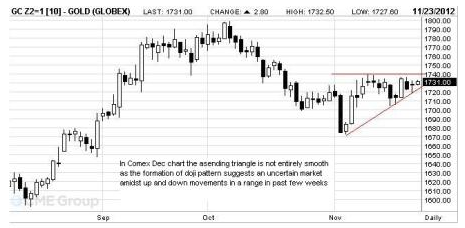
The December Comex Gold chart shows an ascending triangle which is marked by uncertainties as indicated by the doji pattern (with opening and closing prices at a very narrow range). The first line of resistance is at $1740 per ounce while second resistance is at $1750. First support level is at $1702 and second support level is at 1675.

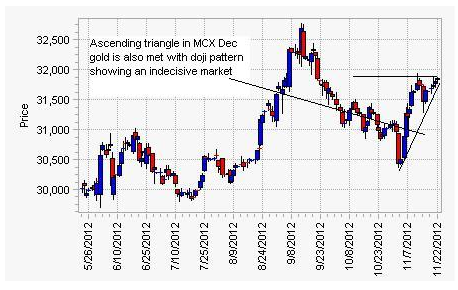
In Gold December futures at India's Multi Commodity Exchange (MCX), the yellow meal is exhibiting some indecisiveness as shown by the doji pattern even as market is generally moving up on account of festival demand and rise in global prices.
The upward movement in prices in recent days is not sufficient for a bullish trend to emerge and could be described as sideways.
3rd party Ad. Not an offer or recommendation by Investing.com. See disclosure here or remove ads.
Which stock should you buy in your very next trade?
AI computing powers are changing the stock market. Investing.com's ProPicks AI includes 6 winning stock portfolios chosen by our advanced AI. In 2024 alone, ProPicks AI identified 2 stocks that surged over 150%, 4 additional stocks that leaped over 30%, and 3 more that climbed over 25%. Which stock will be the next to soar?
Unlock ProPicks AI