
Gold tumbled yesterday, hitting a low of 1,309 during the US session with the majority of the losses coming after the FOMC meeting minutes were released. It is actually rather interesting to see Gold trading lower because of the minutes, as the FOMC actually sounded slightly more dovish than previously. Certainly the minutes did reflect unanimous support for QE tapering, but this is not really news as markets should have already priced this in when the second taper cut was announced.
What was unexpected from the minutes was actually the fact that Fed members are shifting away from unemployment rate as a gauge for hiking interest rates, with some members believing that interest rates need to be kept low for a longer period of time. This should have driven Gold prices higher as it is unlikely that the majority of the market would have priced in a continued low interest rates scenario that extends beyond 2015.
Hence, the decline in Gold prices is unlikely to be fundamentally driven, and the decline—post FOMC minutes—is an indication of the strong bearish sentiment of traders as they have selectively chosen to interpret the minutes as hawkish - thus bearish for Gold.
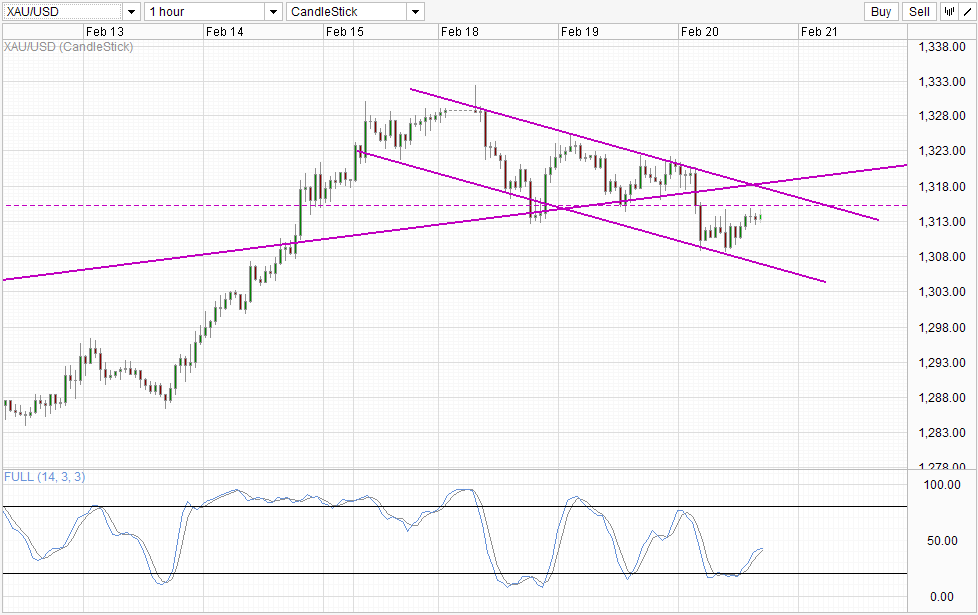
Hourly Chart
 XAU/USD Hourly" title="XAU/USD Hourly" height="242" align="bottom" border="0" width="474">
To be fair, bearish momentum was already in play since Tuesday's peak. Prices did rebound higher on Tuesday's US session, but were capped by the descending Channel Top that is currently in play. Hence, we can also establish that even though underlying sentiment in Gold is now bearish, the magnitude of bearish strength isn't really that formidable and is something that can be thwarted by technical pressures.
All things said and done, what we can reasonably expect based on past behaviour (if they are even relevant) is for prices to tag the Channel Top once again after rebounding from the Channel Bottom during Asian hours today. With risk appetite currently bearish—Asian and European Bourses are trading deeply in the red right now—there will be stronger bullish pressure added which will help prices to, at the very least, stay close to 1,315 resistance even in the case of strong bearish momentum.
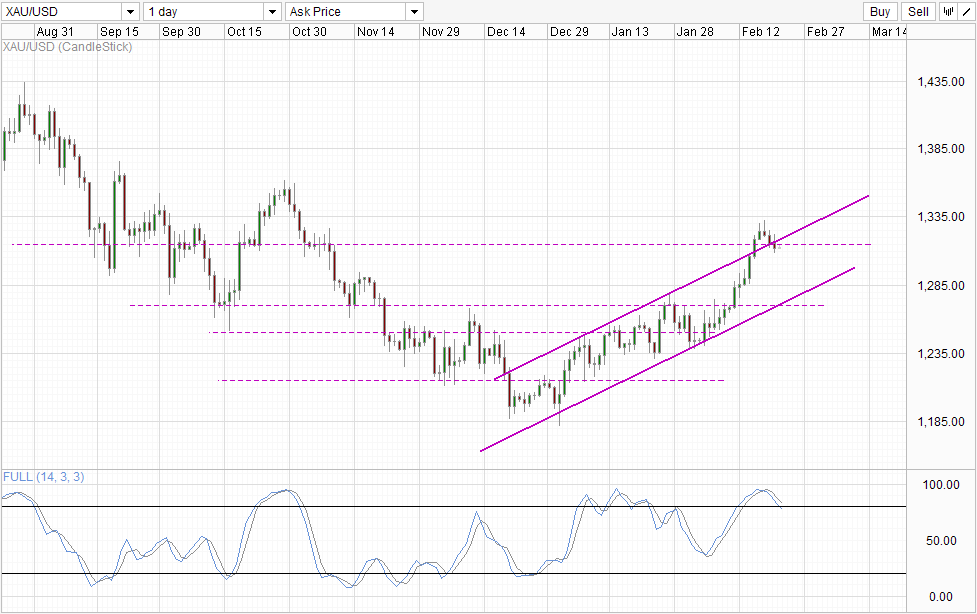
Daily Chart
 XAU/USD Daily" title="XAU/USD Daily" height="242" align="bottom" border="0" width="474">
From the Daily Chart, we can see prices moving back within the rising Channel, while the Stochastic indicator is showing the beginnings of a new bearish cycle, suggesting that prices may be able to move toward the Channel Bottom in the near/mid term, echoing the bearish sentiment seen in the Short-Term. However, given the strong support seen in our short-term analysis, do not expect price to do a free-fall. A measured decline may be more realistic.
Which stock should you buy in your very next trade?
With valuations skyrocketing in 2024, many investors are uneasy putting more money into stocks. Unsure where to invest next? Get access to our proven portfolios and discover high-potential opportunities.
In 2024 alone, ProPicks AI identified 2 stocks that surged over 150%, 4 additional stocks that leaped over 30%, and 3 more that climbed over 25%. That's an impressive track record.
With portfolios tailored for Dow stocks, S&P stocks, Tech stocks, and Mid Cap stocks, you can explore various wealth-building strategies.
