Of course, the whole episode was spot-on groovy for gold, in turn sporting its largest weekly percentage rise since that ending 16 August 2013 by settling yesterday (Friday) at 1280, +4.7% for the week. As shown below in gold's weekly bars chart, price raced right up through the 1240-1280 resistance area, that purple lines-bounded zone technically now becoming support, (some natural near-term retrenchment notwithstanding per our Value and Magnet charts which next follow). As for gold's distance of 122 points above the parabolic price of 1158, 'tis the largest upside span since the week ending 14 March 2014, and on a percentage basis (+14.1%) the most since week's end of 06 September 2013:
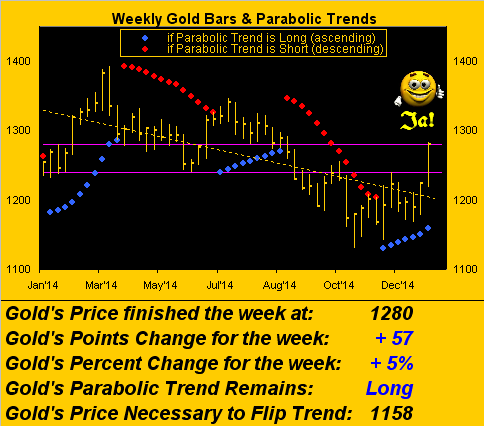
"But, mmb, dead ahead are those Whiny 1290s again, right?"
You've a fine memory there, Squire, as they were quite the annoying area, Gold endlessly traipsing about therein last Summer. But the upsurge this time feels more substantively, indeed long overdue fundamentally, of resolute purpose. 'Tis a bit like old times, non? Some strength in gold and an independent Swiss franc? What's next? An eventual return to the Escudo, Lira, Guilder and Kroon? The Drachma certainly appears first on the doorstep with Greece's general elections but a weekend away, the ensuing Parliament to then elect a new President. Regardless, the currency printing tumblers at the European Central Bank will soon be a-spinnin', indeed in earnest given European court adviser Pedro "Cruz to Victory" Villalon's having just opined that bond-buying stimulus for eurozone is legal, such that more ECB Quantitative Easing can sally forth.
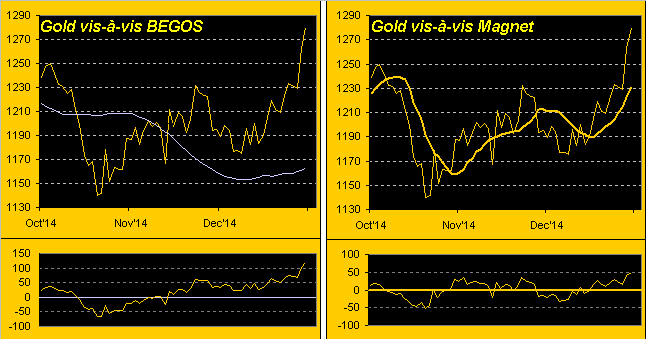
With respect to the aforementioned notion of some near-term price retrenchment, we turn to this two-panel graphic of gold for the last three months (63 trading days)-to-date. Both panels show gold to be presently strong, and yet "high" via their respective measures. On the left is gold vis-à-vis its smooth, pearly valuation line derived from price movement relative to same within the five primary components that comprise BEGOS (Bond / Euro / Gold / Oil / S&P). On the right is gold vis-à-vis its Market Magnet derived from the "contract volume per price point" data which also form the Market Profile at which we'll later look. The oscillators (price less metric) at the foot of both panels suggest gold is a bit upside-stretched at the moment, (but we're not complaining):
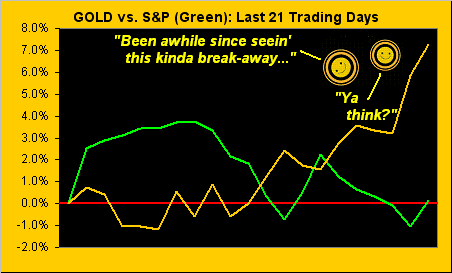
As for gold versus the S&P month-over-month, (21 trading days-to-date), the former is +7% whilst the latter is, well, flat at best, its trend in descent:
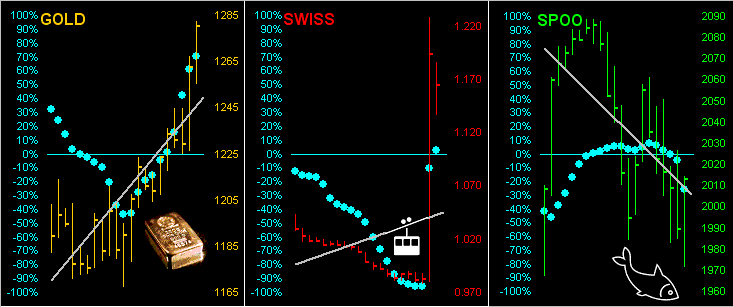
Speaking of trend, 'tis time to bring up the "Baby Blues" as we again review the last 21 trading days via linear regression trend consistency, which for the Swiss franc in the center panel has to be the most violent throwing off of a trend's rails we've ever seen. Gold is in the left-hand panel, the continuity of its rising blue dots nothing short of brilliant, whilst the in the right-hand panel the S&P is no more, we think, the place to be as its Baby Blues tumble into the sea:
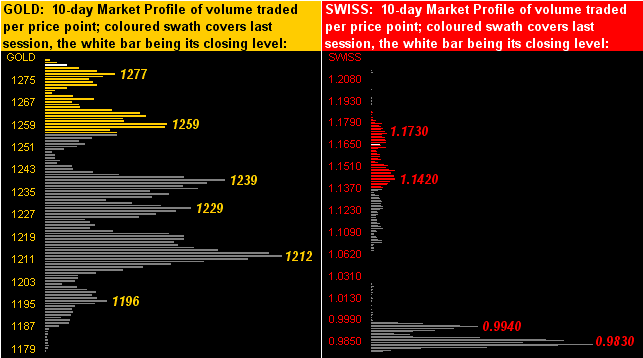
This week's final graphic is of Gold's 10-day Market Profile, and again to help visualize the move of the Swiss franc, we've added as well its Profile. Gold's attendant trading supports are as indicated in the panel on the left. Those for the Swiss franc are more difficult to as yet discern, the 1.1730 price suggesting some resistance; nonetheless, were one indeed on the right side, the breadth of such monstrous move ought keep one in geschnetzeltes for life. "Mehr bier, bitte!"
We'll wrap it here with:
The Gold Stack
Gold's Value per Dollar Debasement: 2458
Gold’s All-Time High: 1923 (06 September 2011)
The Gateway to 2000: 1900+
The Final Frontier: 1800-1900
The Northern Front: 1750-1800
On Maneuvers: 1579-1750
The Floor: 1466-1579
Le Sous-sol: Sub-1466
Base Camp: 1377
Neverland: The Whiny 1290s
Year-to-Date High: 1282
10-Session directional range: up to 1282 from 1178 = +104 points or +9%
Structural Resistance: 1281 / 1288 / 1293
Trading Resistance: (none)
Gold Currently: 1280, (weighted-average trading range per day: 22 points)
Support Band: 1280-1240
Trading Support: 1277 / 1259 / 1239 / 1229 / 1212 / 1196
The 300-day Moving Average: 1262
Structural Support: 1255 / 1239
10-Session “volume-weighted” average price magnet: 1231
Year-to-Date Low: 1167
The Weekly Parabolic Price to flip Short: 1158
Which stock should you buy in your very next trade?
With valuations skyrocketing in 2024, many investors are uneasy putting more money into stocks. Unsure where to invest next? Get access to our proven portfolios and discover high-potential opportunities.
In 2024 alone, ProPicks AI identified 2 stocks that surged over 150%, 4 additional stocks that leaped over 30%, and 3 more that climbed over 25%. That's an impressive track record.
With portfolios tailored for Dow stocks, S&P stocks, Tech stocks, and Mid Cap stocks, you can explore various wealth-building strategies.