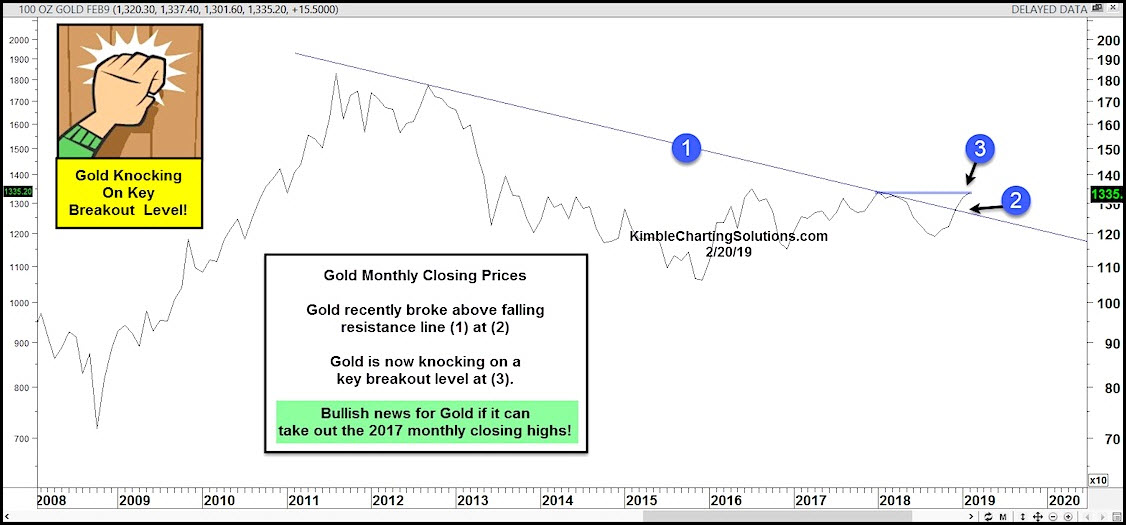
For the past 5 years, gold prices have traded sideways. There were plenty of “trades” to be made, but that type of price action tends to grind out long-term bulls and bears.
You can see this in today’s “monthly” closing chart for gold (shown above).
Gold bulls caught a break recently when the metal broke out above its multi-year downtrend line at (1) and (2). That spurred a big advance in metals and mining stocks.
Can gold bugs and bulls keep the momentum going? We should find out shortly.
Currently, gold is knocking on a key breakout resistance level at (3). If Gold can breakout above the 2017 monthly closing highs, it'll send a bullish message to the bulls.
Which stock should you buy in your very next trade?
AI computing powers are changing the stock market. Investing.com's ProPicks AI includes 6 winning stock portfolios chosen by our advanced AI. In 2024 alone, ProPicks AI identified 2 stocks that surged over 150%, 4 additional stocks that leaped over 30%, and 3 more that climbed over 25%. Which stock will be the next to soar?
Unlock ProPicks AI
