Gold/Metals bulls want to pay attention to how this indicator handles a current breakout test.
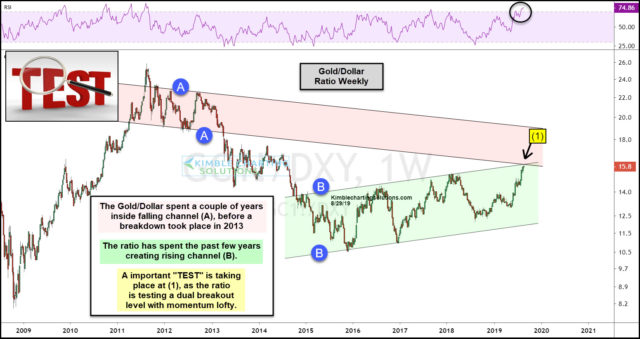
This chart looks at the Gold:Dollar ratio on a weekly basis over the past decade.
The ratio created a falling channel (A) from 2011 to 2013. Once support broke, gold continued to be much weaker than the US dollar for a few years.
The ratio started creating a rising channel (B) in 2016/2017, as higher lows started forming. These higher lows reflected that gold was outperforming USD.
The rally over the past couple of years has the ratio testing the top of rising channel (B) and the underside of falling channel (A) at (1).
It appears that a very important long-term breakout test is in play, with momentum at the highest level in 8 years.
How the ratio handles this breakout test will send gold and silver a very important long-term message.
Which stock should you buy in your very next trade?
With valuations skyrocketing in 2024, many investors are uneasy putting more money into stocks. Unsure where to invest next? Get access to our proven portfolios and discover high-potential opportunities.
In 2024 alone, ProPicks AI identified 2 stocks that surged over 150%, 4 additional stocks that leaped over 30%, and 3 more that climbed over 25%. That's an impressive track record.
With portfolios tailored for Dow stocks, S&P stocks, Tech stocks, and Mid Cap stocks, you can explore various wealth-building strategies.

