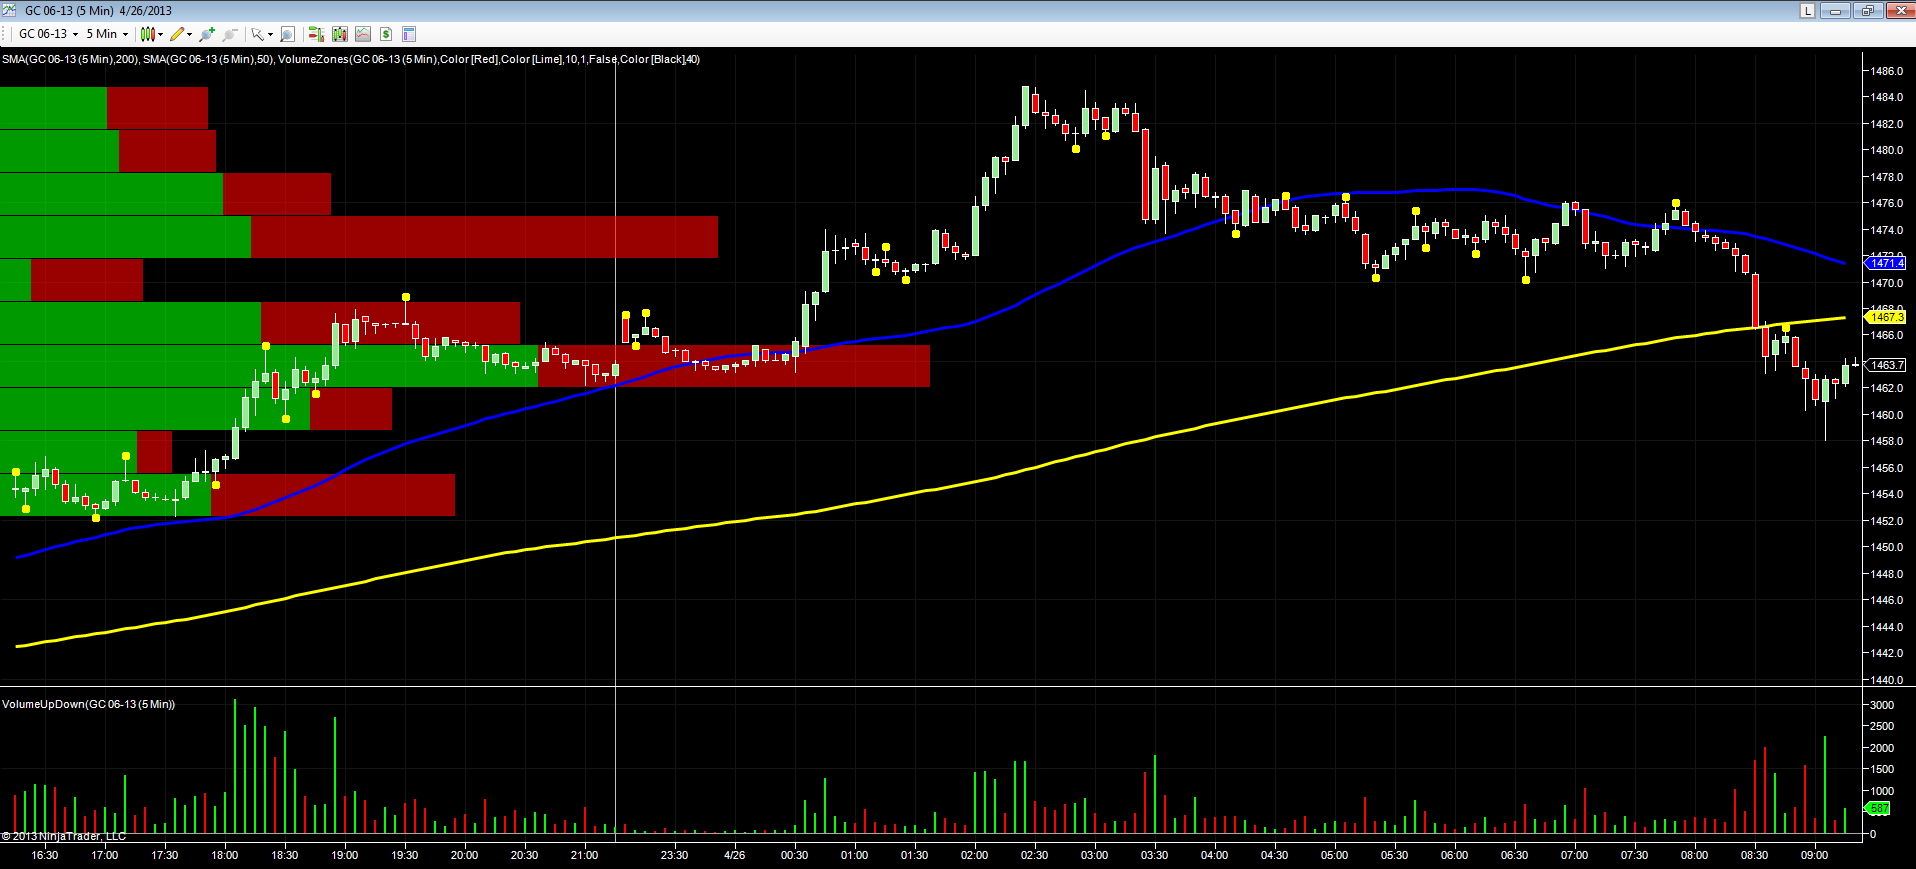
A very short post just to round off the week, with the June GC gold futures contract on the five minute chart. I normally post the longer term daily and weekly, but for intra day traders, whether short or long, the opportunities are always there. This is the electronic contract trading on Globex overnight and into the London open, with the blue line the 50 SMA and the yellow line the 200 SMA. Volumes as you would expect are relatively light given the physical market is currently closed.
Nevertheless some nice trading opportunities this morning, which really put into context the whole debate about whether gold is set to fall, or rise longer term, and here I’m talking in terms of weeks or months. Whilst this may be important to longer term investors in the precious metal, for short-term traders it really makes little difference. All we are concerned about is getting the direction right today.
This morning’s trigger was the breakout from the sideways congestion in the $1476 to $1470 per ounce level – a clear region, and extremely well-defined by pivots both to the upper level and lower level, and once the floor had been breached, a nice short trade developed. This was given further downwards momentum by the initial break below the 50 SMA, with the contract given a further bearish shove lower, following the breach of the 200 SMA, coupled with a pivot high in the $1467 per ounce area.
3rd party Ad. Not an offer or recommendation by Investing.com. See disclosure here or remove ads.
Whilst writing the post, note the high volume which has now appeared, the green volume bar associated with the green candle, which has pushed the gold price back above the $1460 per ounce level. If we see volumes rising with rising prices then this could be turning point, but given the above, this may simply be a short term reversal. Volume as always will tell us! To the left of the chart, the volume at price histogram is giving a clear signal of price resistance now overhead in the $1464 to $1466 per ounce area, and any move higher from here may run out of steam at this level.Below, the support area in the $1454 to $1456 per ounce area awaits, and if this is breached then expect to see gold push lower to test the $1450 per ounce level in due course.
A quick analysis and hopefully one that provides a sligthly different perspective.
Which stock should you buy in your very next trade?
With valuations skyrocketing in 2024, many investors are uneasy putting more money into stocks. Unsure where to invest next? Get access to our proven portfolios and discover high-potential opportunities.
In 2024 alone, ProPicks AI identified 2 stocks that surged over 150%, 4 additional stocks that leaped over 30%, and 3 more that climbed over 25%. That's an impressive track record.
With portfolios tailored for Dow stocks, S&P stocks, Tech stocks, and Mid Cap stocks, you can explore various wealth-building strategies.
