
As we can see on the daily chart for gold, prices are having trouble breaking above the 1,254 level where very close to it we see the 55 EMA (purple line) acting as a strong resistance as well. If we see global optimism on the financial markets pick up, then gold may stop its retracement at this level and go back to a downtrend. The 1,200 level is still a strong support for the precious metal, but a little lower we also have the 1,187 level which is an even more important support. Therefore, we must be watchful for a possible visit to any of these support levels, because we may find a good opportunity to go long (buy) from there.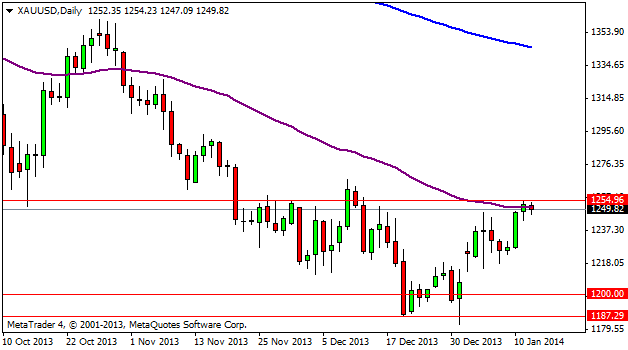 XAU/USD Daily Chart" title="XAU/USD Daily Chart" width="452" height="351" />
On the 4 hour chart we can see more closely the consolidation that is currently having around the 1,254 level and how it tries to come back down from that area. There is an interesting support at the 1,238 where we can see the 200 EMA (blue line). If the price comes back down to this EMA, then it may try to jump back up in the near term. Therefore, we may find a good opportunity here to go long (buy).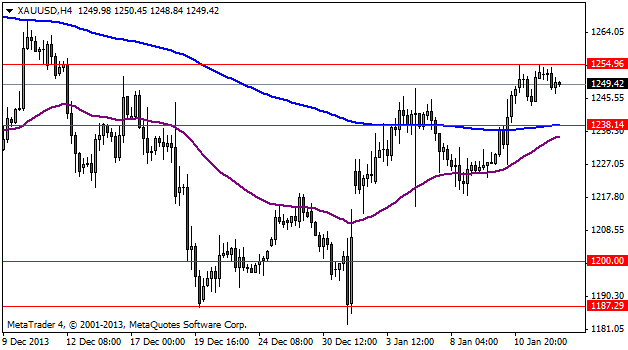 XAU/USD 4 Hour Chart" title="XAU/USD 4 Hour Chart" width="452" height="351" />
Which stock should you buy in your very next trade?
AI computing powers are changing the stock market. Investing.com's ProPicks AI includes 6 winning stock portfolios chosen by our advanced AI. In 2024 alone, ProPicks AI identified 2 stocks that surged over 150%, 4 additional stocks that leaped over 30%, and 3 more that climbed over 25%. Which stock will be the next to soar?
Unlock ProPicks AI