Bitcoin price today: reaches new record high over $122k ahead of ’crypto week’
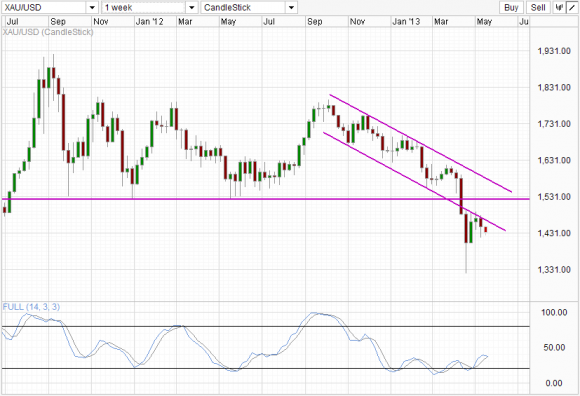
Last week was all about USD strength, and it is no surprise that Gold prices started to pull lower on a stronger USD. For the technically inclined, the decline in Gold prices lined up nicely with the bearish rejection pattern that we were looking out for following the spinning top candlestick that was formed 2 weeks ago.
Why were we looking out for a bearish rejection pattern?
Well, gold prices did pull back significantly with price recovering more than 100 USD an ounce following one of the greatest sell-offs in recent years. However, price was approaching the previous descending channel with channel bottom most likely going to provide significant resistance especially since the trend was already heading lower even before the significant sell-off.
The Spinning Top Candlestick that was formed 2 weeks ago was a warning sign that there is weakness in the bulls or at least uncertainty just under the descending channel. Despite seeing signs of weakness, there is no surety that price will not push inside the channel, especially if any strong fundamental catalyst was made available last week.
As such, we were waiting for a confirmation before we can be more certain (there are no 100% absolutes in trading) that a rebound from the channel bottom is under way.
Weekly Chart

With last week’s candle bearish closing, we now have the confirmation that was sought before. It is also good that the body of the confirmation candle is larger than the spinning top prior to it. Admittedly that is not a difficult task as a spinning top candle is characterized by having a small body to begin with.
Nonetheless, to have the confirmation candle engulfing the signal candle is always welcome. However, the confirmation candle is less bearish than it probably could be, with a long tail suggesting that significant bullish pullback has occurred, while price did not close lower than the low of prior weeks, indicating a missed opportunity for bears to deliver the fatal blow for a strong bearish reversal.
The damage done seems to be enough though, as price started bearishly on Monday, yet it is important to note that bears are still not out of the woods, with price still yet able to test the previous week’s low. Given the missed bearish opportunities last week, conservative traders may wish to seek further confirmation of bearish intent to ensure that this bearish rejection has legs to run.
Hourly Chart

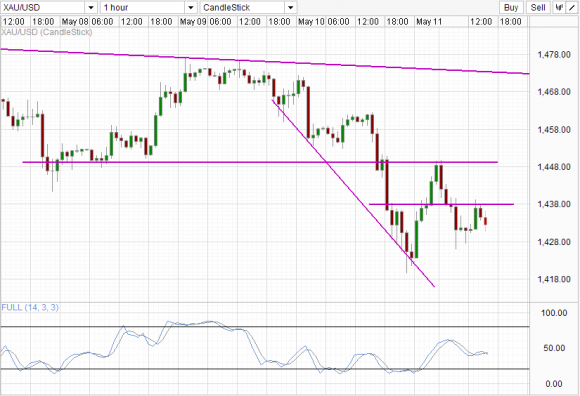
The short term chart seems to agree with the bearish outlook, with price trading steadily lower. Just a few hours ago we saw the rejection of 1,438 interim resistance, which opens up a move back towards 1,428 interim support and potentially a move towards the descending trendline. Stochastic readings agree with the bearish outlook, with readings forming an interim top, suggesting the continuation of the bear cycle as of Monday's open is possible.
Traders should also continue to watch out for USD strength this week as there remains the possibility of a significant pullback due to weakness in US stock futures. This is unlikely to change the longer-term direction of Gold but may certainly stall any furtherance of bearish efforts in the short-term, which increases the importance of further confirmation as mentioned earlier.
Why were we looking out for a bearish rejection pattern?
Well, gold prices did pull back significantly with price recovering more than 100 USD an ounce following one of the greatest sell-offs in recent years. However, price was approaching the previous descending channel with channel bottom most likely going to provide significant resistance especially since the trend was already heading lower even before the significant sell-off.
The Spinning Top Candlestick that was formed 2 weeks ago was a warning sign that there is weakness in the bulls or at least uncertainty just under the descending channel. Despite seeing signs of weakness, there is no surety that price will not push inside the channel, especially if any strong fundamental catalyst was made available last week.
As such, we were waiting for a confirmation before we can be more certain (there are no 100% absolutes in trading) that a rebound from the channel bottom is under way.
Weekly Chart

With last week’s candle bearish closing, we now have the confirmation that was sought before. It is also good that the body of the confirmation candle is larger than the spinning top prior to it. Admittedly that is not a difficult task as a spinning top candle is characterized by having a small body to begin with.
3rd party Ad. Not an offer or recommendation by Investing.com. See disclosure here or remove ads.
Nonetheless, to have the confirmation candle engulfing the signal candle is always welcome. However, the confirmation candle is less bearish than it probably could be, with a long tail suggesting that significant bullish pullback has occurred, while price did not close lower than the low of prior weeks, indicating a missed opportunity for bears to deliver the fatal blow for a strong bearish reversal.
The damage done seems to be enough though, as price started bearishly on Monday, yet it is important to note that bears are still not out of the woods, with price still yet able to test the previous week’s low. Given the missed bearish opportunities last week, conservative traders may wish to seek further confirmation of bearish intent to ensure that this bearish rejection has legs to run.
Hourly Chart

The short term chart seems to agree with the bearish outlook, with price trading steadily lower. Just a few hours ago we saw the rejection of 1,438 interim resistance, which opens up a move back towards 1,428 interim support and potentially a move towards the descending trendline. Stochastic readings agree with the bearish outlook, with readings forming an interim top, suggesting the continuation of the bear cycle as of Monday's open is possible.
Traders should also continue to watch out for USD strength this week as there remains the possibility of a significant pullback due to weakness in US stock futures. This is unlikely to change the longer-term direction of Gold but may certainly stall any furtherance of bearish efforts in the short-term, which increases the importance of further confirmation as mentioned earlier.
3rd party Ad. Not an offer or recommendation by Investing.com. See disclosure here or remove ads.
Which stock should you buy in your very next trade?
AI computing powers are changing the stock market. Investing.com's ProPicks AI includes 6 winning stock portfolios chosen by our advanced AI. In 2024 alone, ProPicks AI identified 2 stocks that surged over 150%, 4 additional stocks that leaped over 30%, and 3 more that climbed over 25%. Which stock will be the next to soar?
Unlock ProPicks AI